 7
7peptides
spectra
0.000 | 0.000
0.001 | 0.055
0.000 | 0.000
0.000 | 0.000
0.000 | 0.042
0.064 | 0.135
0.832 | 0.870
0.000 | 0.000
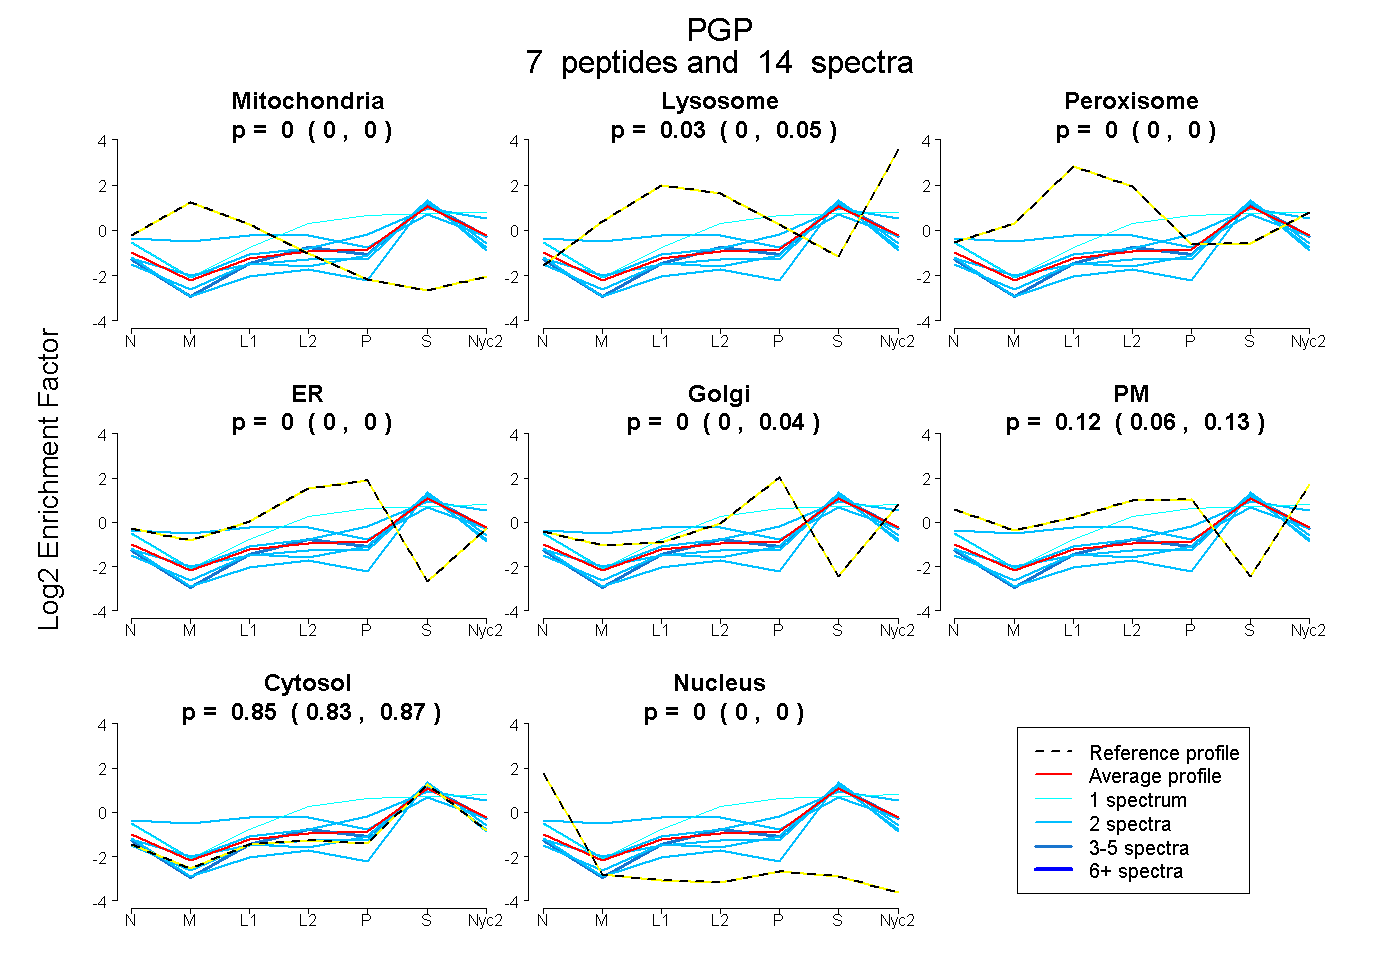
| Plot | Mito | Lyso | Perox | ER | Golgi | PM | Cytosol | Nucleus | |||||
| Expt A |
7 peptides |
14 spectra |
|
0.000 0.000 | 0.000 |
0.030 0.001 | 0.055 |
0.000 0.000 | 0.000 |
0.000 0.000 | 0.000 |
0.000 0.000 | 0.042 |
0.116 0.064 | 0.135 |
0.854 0.832 | 0.870 |
0.000 0.000 | 0.000 |
| 2 spectra, TAYAEK | 0.000 | 0.000 | 0.000 | 0.000 | 0.005 | 0.000 | 0.995 | 0.000 | ||
| 2 spectra, LDTDILLGSTCSLK | 0.096 | 0.000 | 0.272 | 0.000 | 0.000 | 0.096 | 0.536 | 0.000 | ||
| 3 spectra, AVEMAAQR | 0.000 | 0.033 | 0.000 | 0.000 | 0.017 | 0.023 | 0.926 | 0.000 | ||
| 2 spectra, LGFITNNSSK | 0.000 | 0.000 | 0.000 | 0.000 | 0.000 | 0.000 | 0.936 | 0.064 | ||
| 1 spectrum, LGFLYDLDK | 0.000 | 0.156 | 0.000 | 0.018 | 0.177 | 0.115 | 0.534 | 0.000 | ||
| 2 spectra, SNQESDCMFK | 0.044 | 0.004 | 0.000 | 0.000 | 0.002 | 0.016 | 0.934 | 0.000 | ||
| 2 spectra, LAGVPDPK | 0.000 | 0.055 | 0.000 | 0.000 | 0.041 | 0.193 | 0.711 | 0.000 |
| Plot | Mito | Lyso or Perox | ER | Golgi | PM | Cytosol | Nucleus | ||||||
| Expt B |
1 peptide |
1 spectrum |
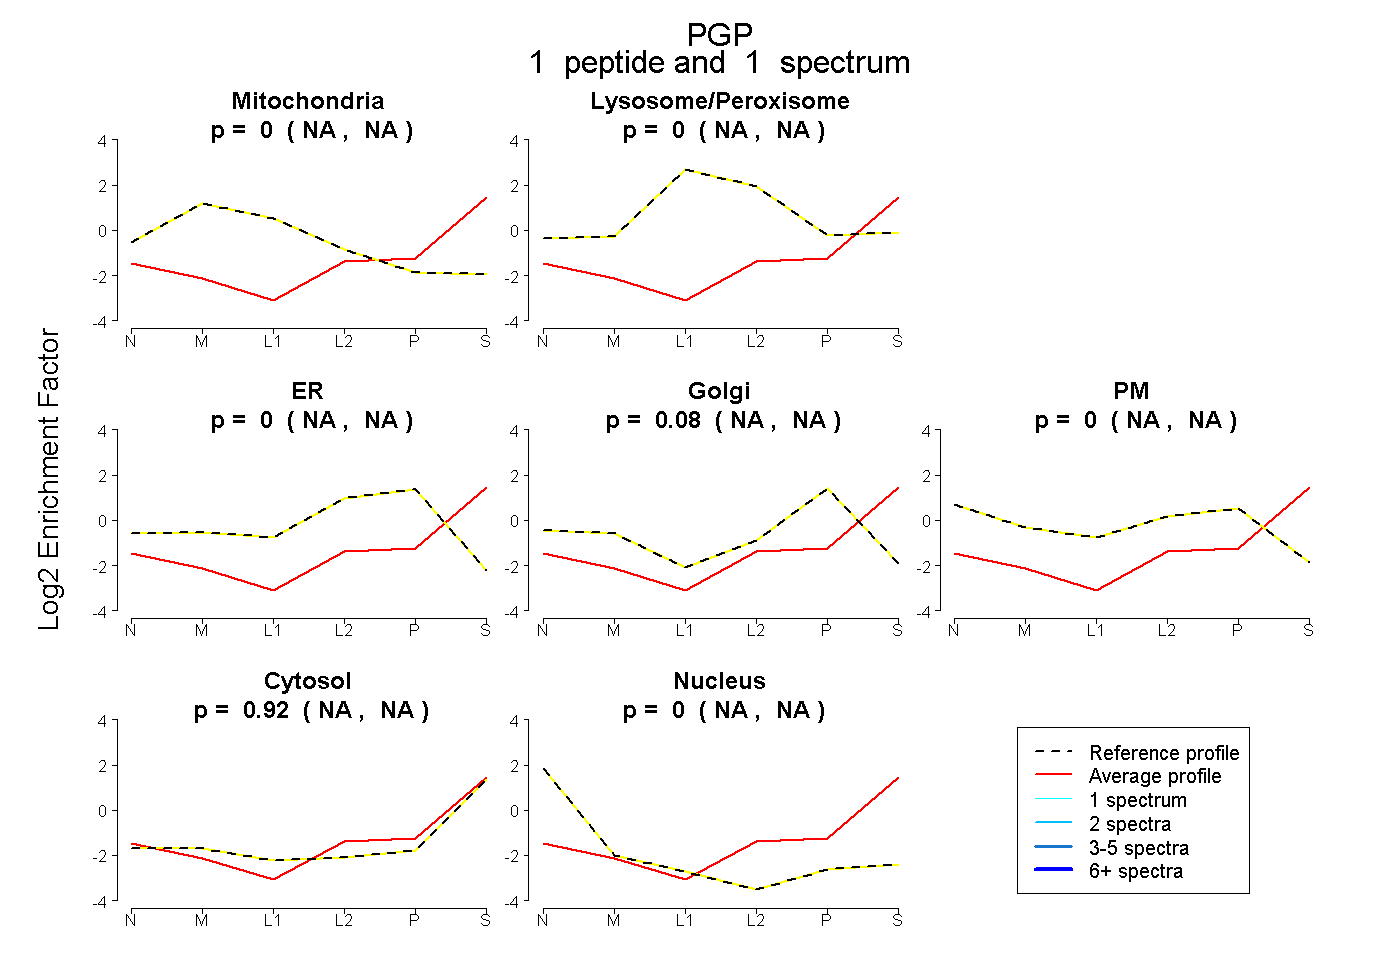 |
0.000 NA | NA |
0.000 NA | NA |
0.000 NA | NA |
0.077 NA | NA |
0.000 NA | NA |
0.923 NA | NA |
0.000 NA | NA |
|||
| Plot | Lyso | Other | |||||||||||
| Expt C |
5 peptides |
12 spectra |
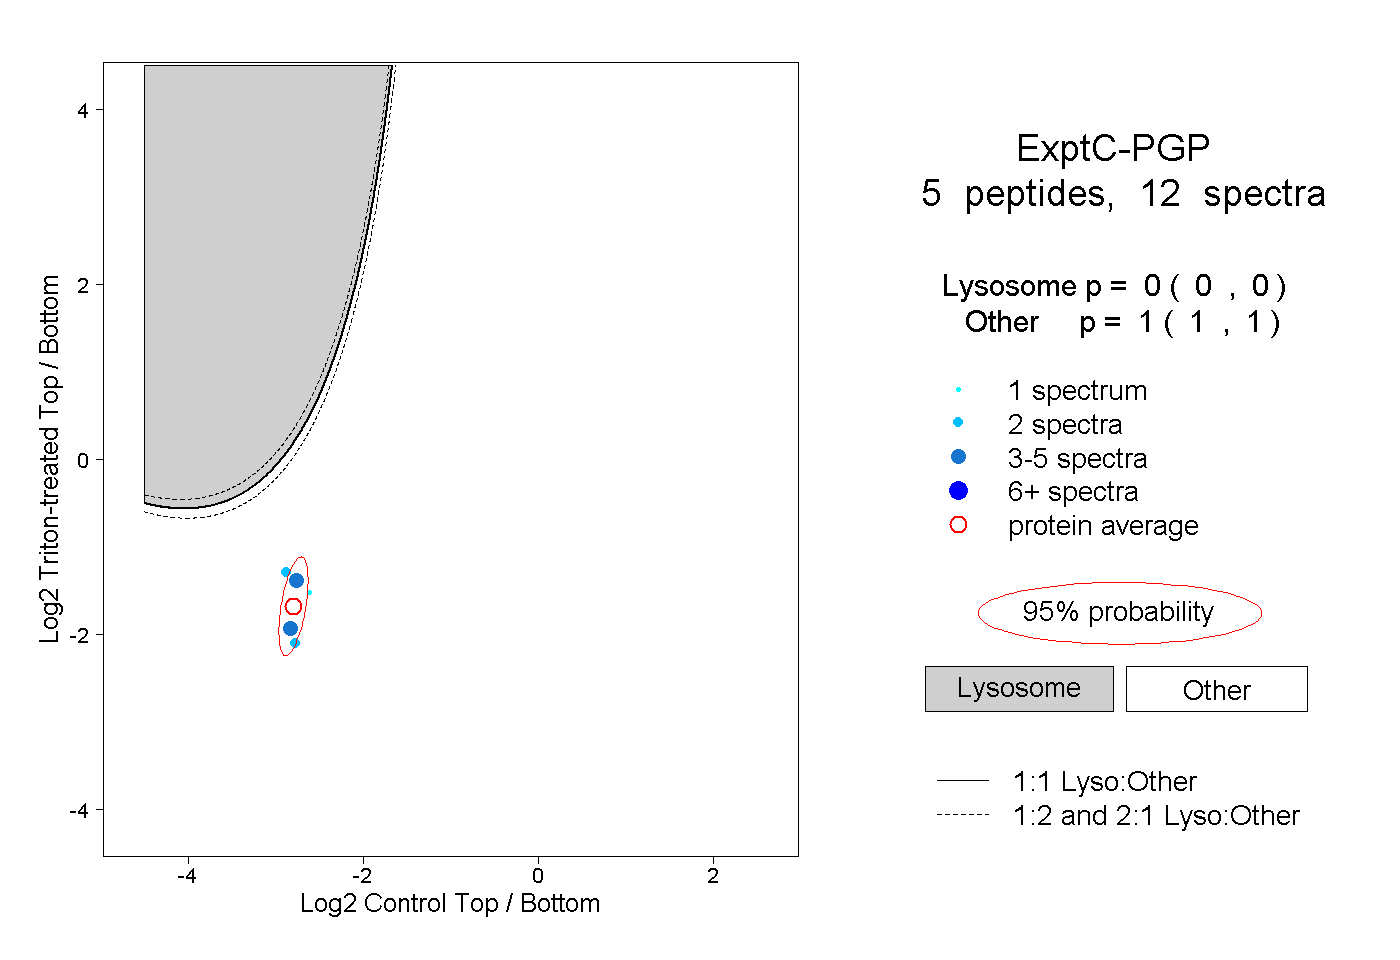 |
0.000 0.000 | 0.000 |
1.000 1.000 | 1.000 |
||||||||
| Plot | Lyso | Other | |||||||||||
| Expt D |
1 peptide |
1 spectrum |
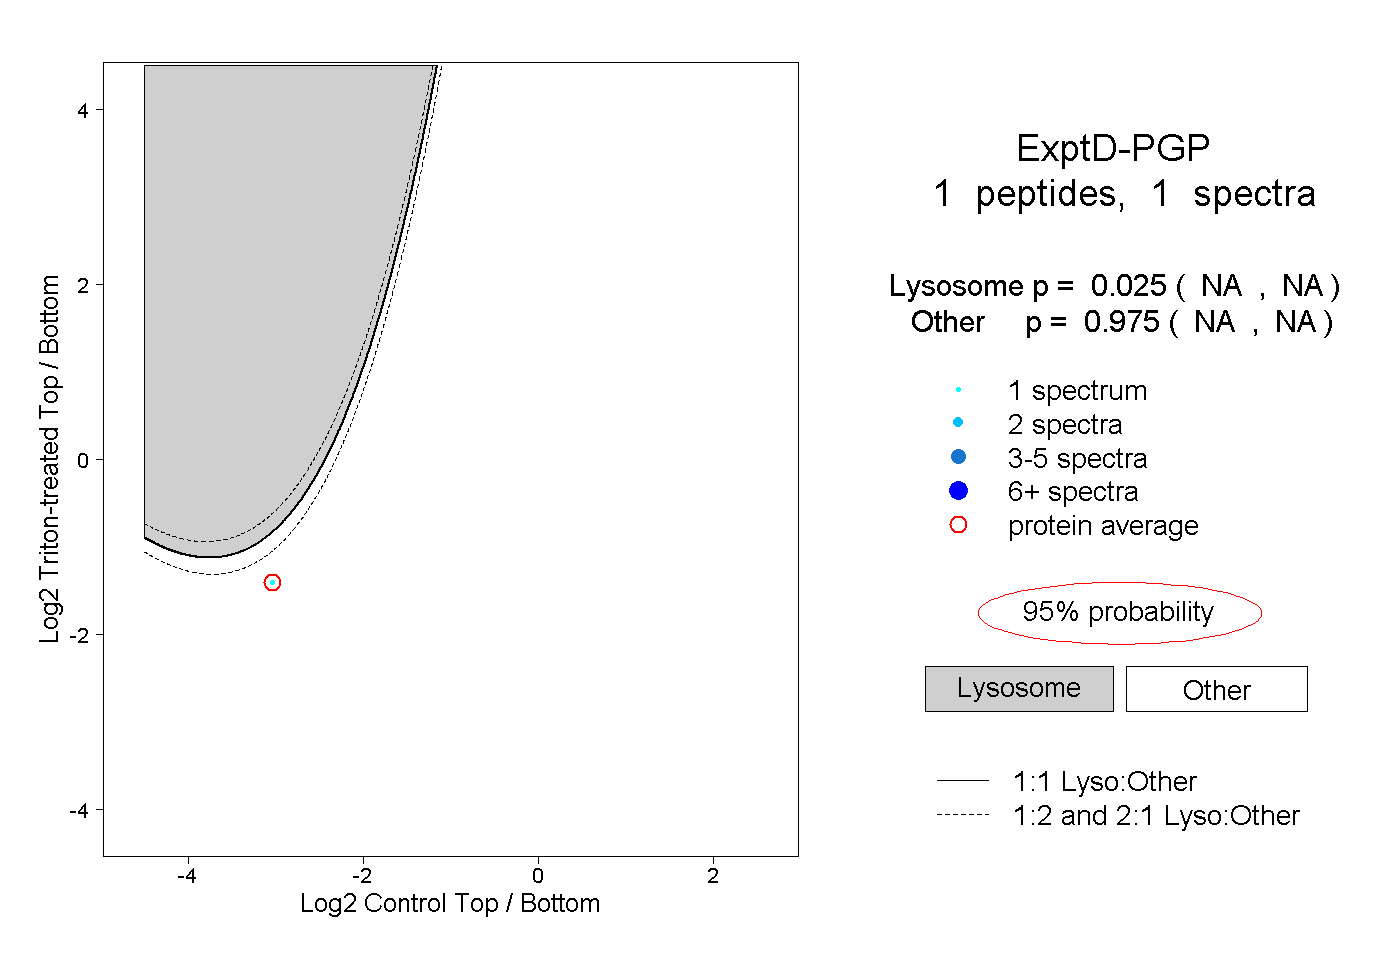 |
0.025 NA | NA |
0.975 NA | NA |