 3
3peptides
spectra
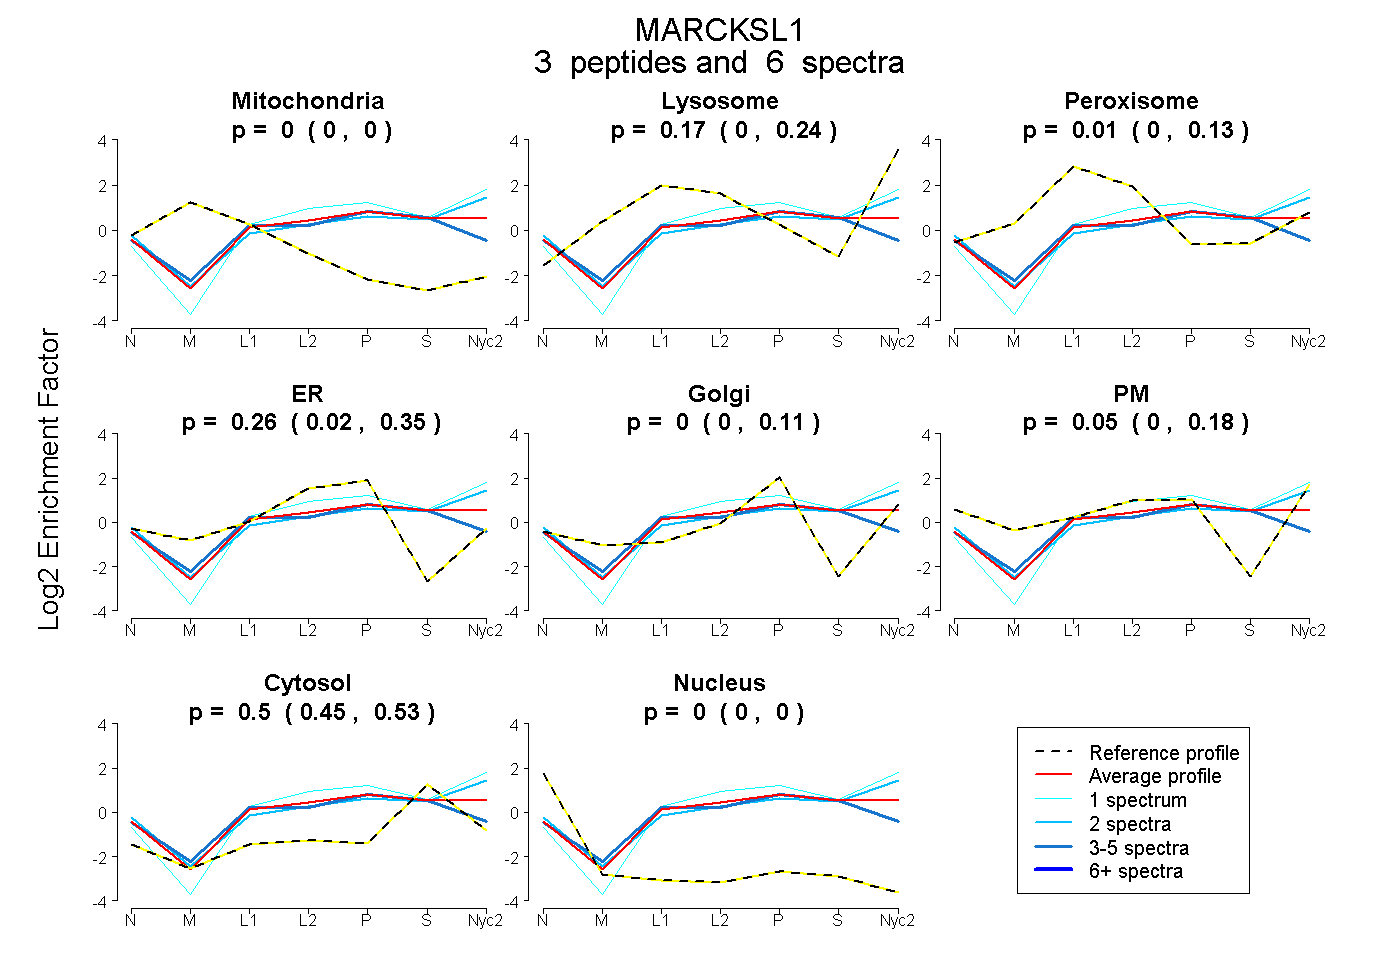
0.000 | 0.000
0.000 | 0.243
0.000 | 0.131
0.018 | 0.349
0.000 | 0.111
0.000 | 0.175
0.455 | 0.531
0.000 | 0.000
2peptides
spectra
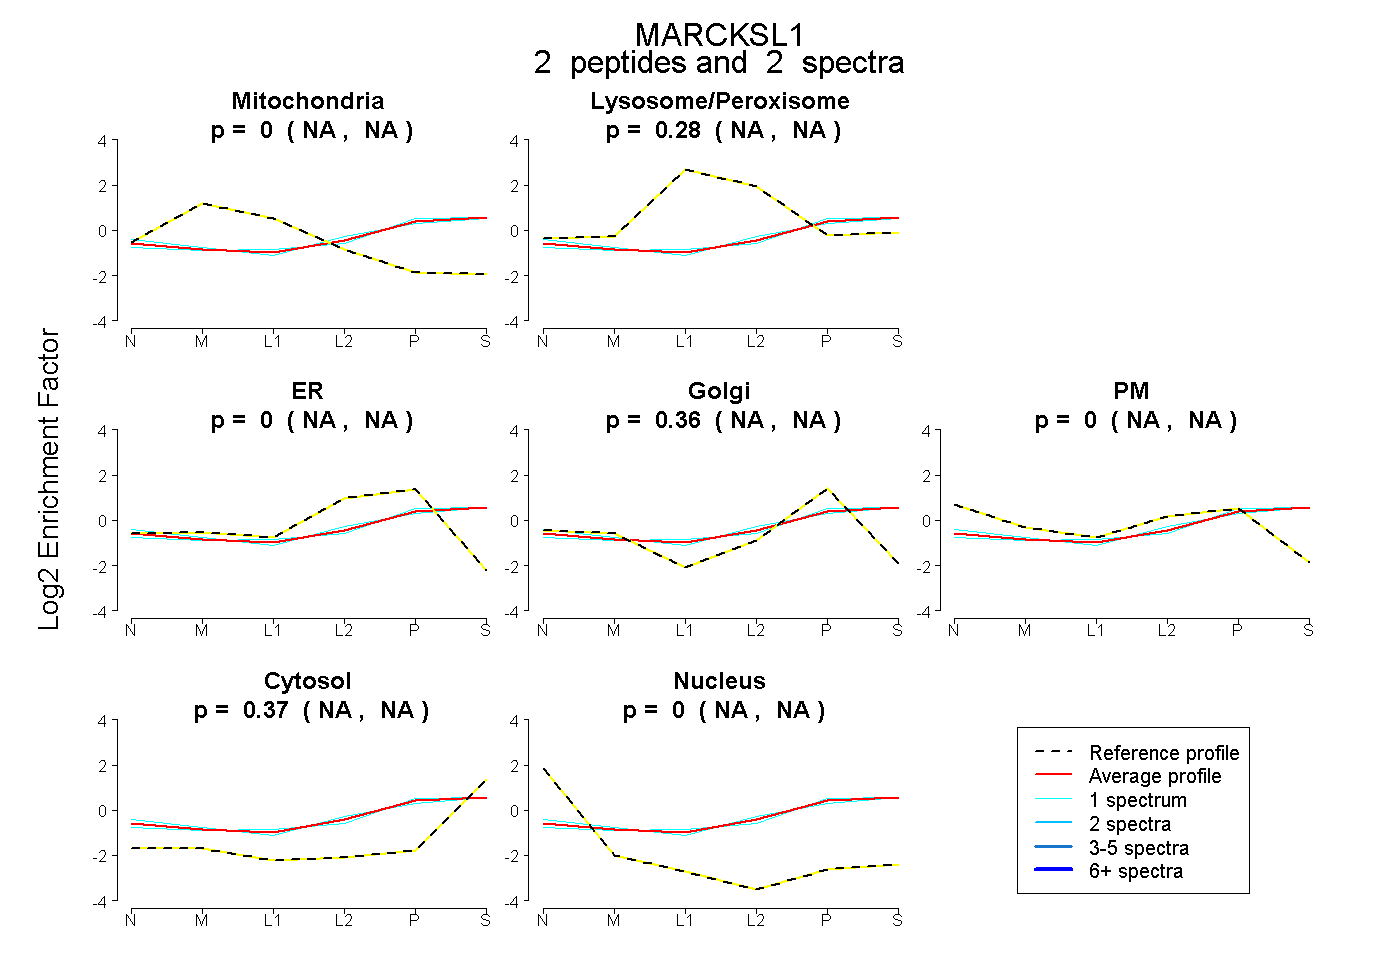
NA | NA
NA | NA
NA | NA
NA | NA
NA | NA
NA | NA
NA | NA
6peptides
spectra
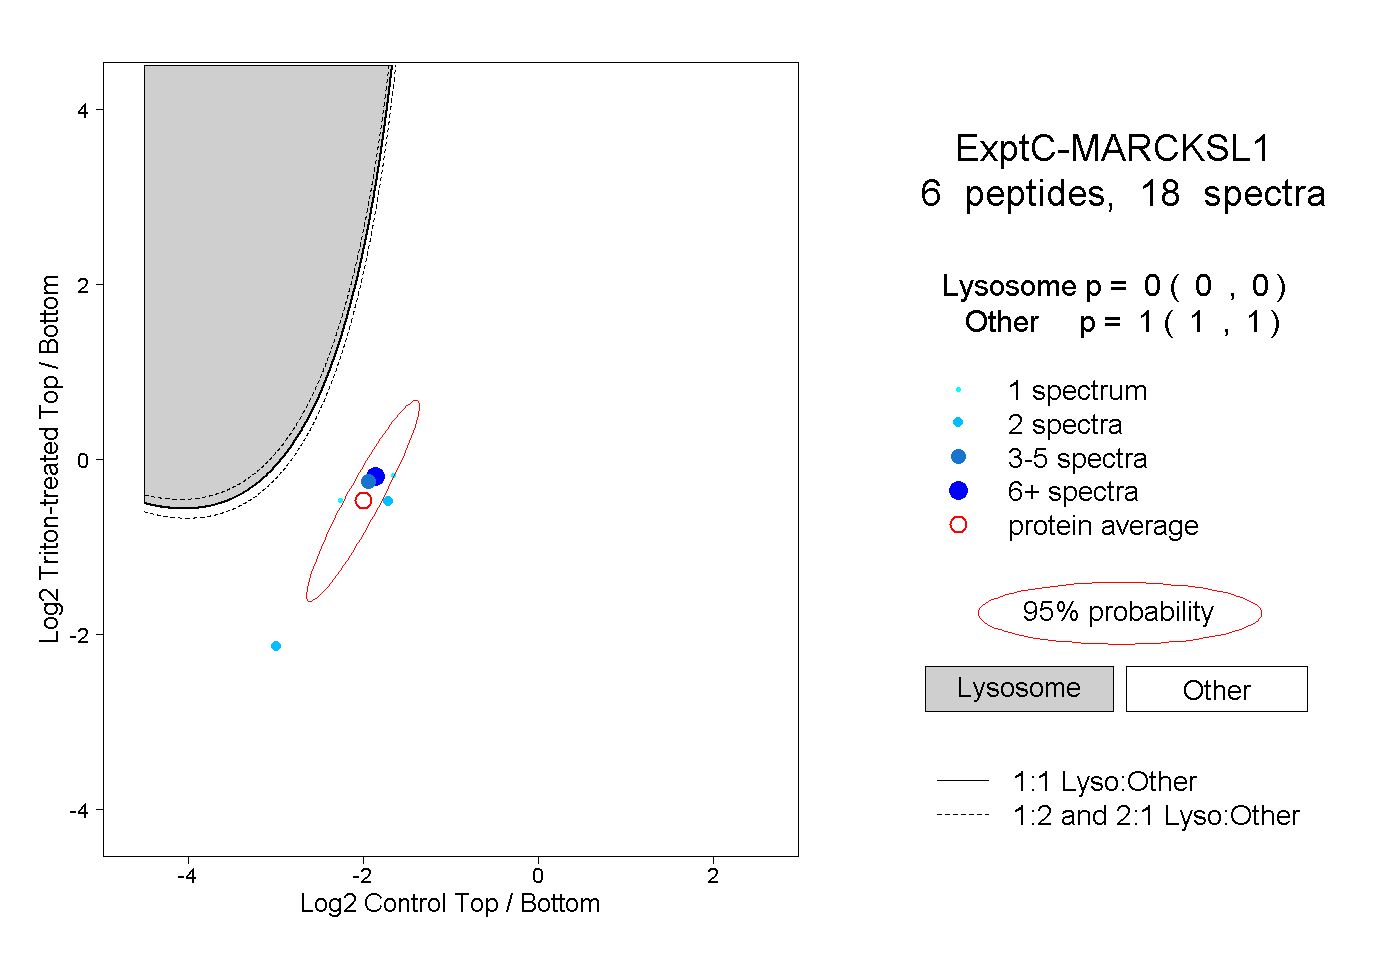
0.000 | 0.000
1.000 | 1.000