 3
3peptides
spectra
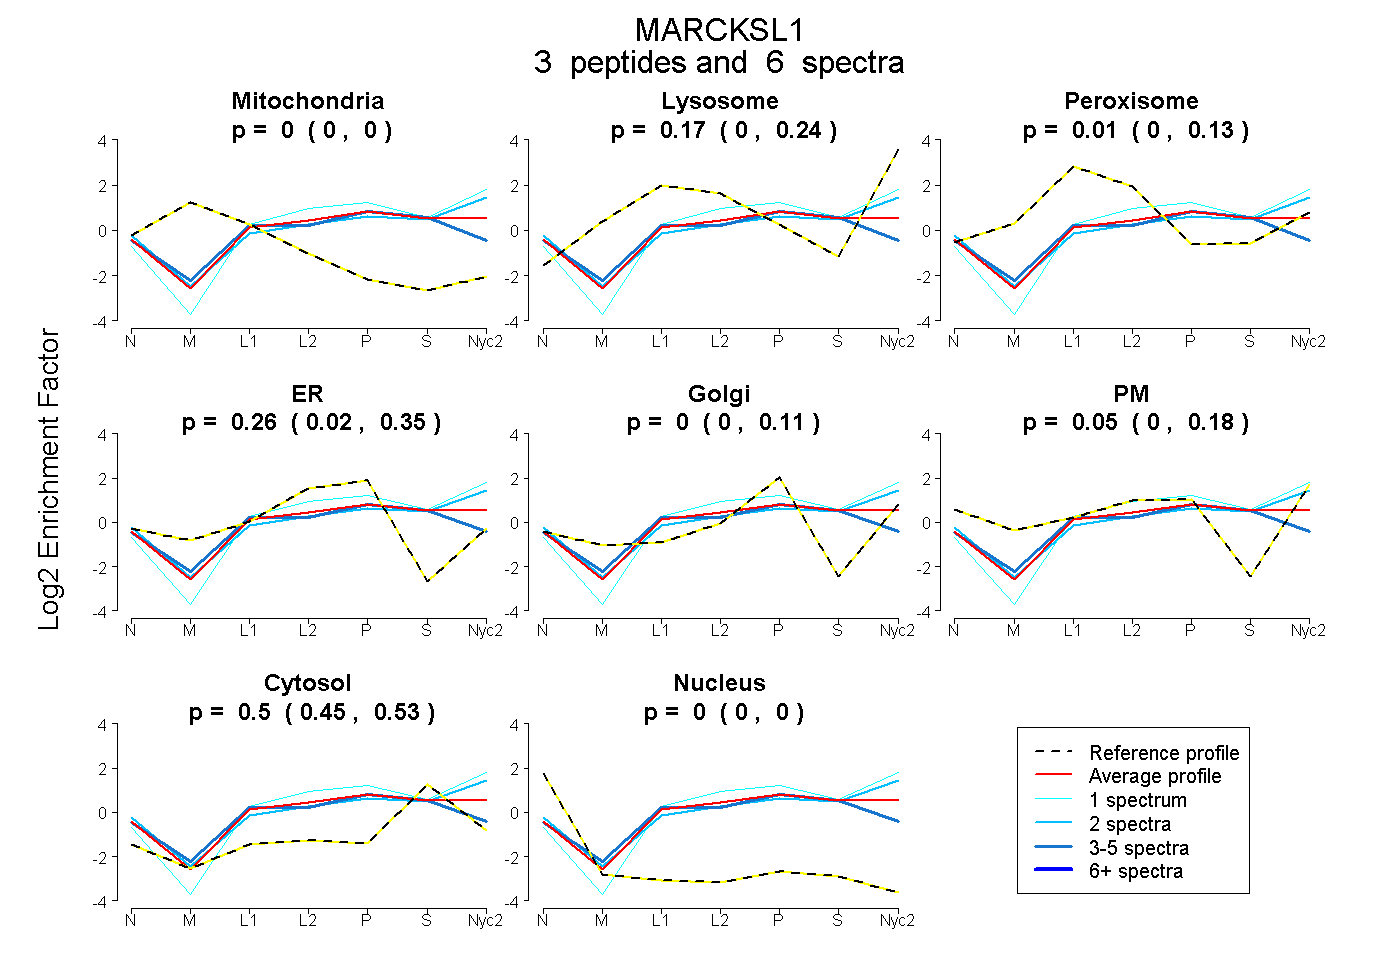
0.000 | 0.000
0.000 | 0.243
0.000 | 0.131
0.018 | 0.349
0.000 | 0.111
0.000 | 0.175
0.455 | 0.531
0.000 | 0.000
| Plot | Mito | Lyso | Perox | ER | Golgi | PM | Cytosol | Nucleus | |||||
| Expt A |
3 peptides |
6 spectra |
|
0.000 0.000 | 0.000 |
0.173 0.000 | 0.243 |
0.007 0.000 | 0.131 |
0.263 0.018 | 0.349 |
0.000 0.000 | 0.111 |
0.052 0.000 | 0.175 |
0.505 0.455 | 0.531 |
0.000 0.000 | 0.000 |
| 3 spectra, LSGLSFK | 0.000 | 0.000 | 0.148 | 0.338 | 0.000 | 0.000 | 0.514 | 0.000 | ||
| 1 spectrum, GDVTAEEAAGASPAK | 0.000 | 0.319 | 0.000 | 0.052 | 0.197 | 0.000 | 0.432 | 0.000 | ||
| 2 spectra, AAATPESQEPQAK | 0.000 | 0.187 | 0.000 | 0.000 | 0.028 | 0.299 | 0.485 | 0.000 |
| Plot | Mito | Lyso or Perox | ER | Golgi | PM | Cytosol | Nucleus | ||||||
| Expt B |
2 peptides |
2 spectra |
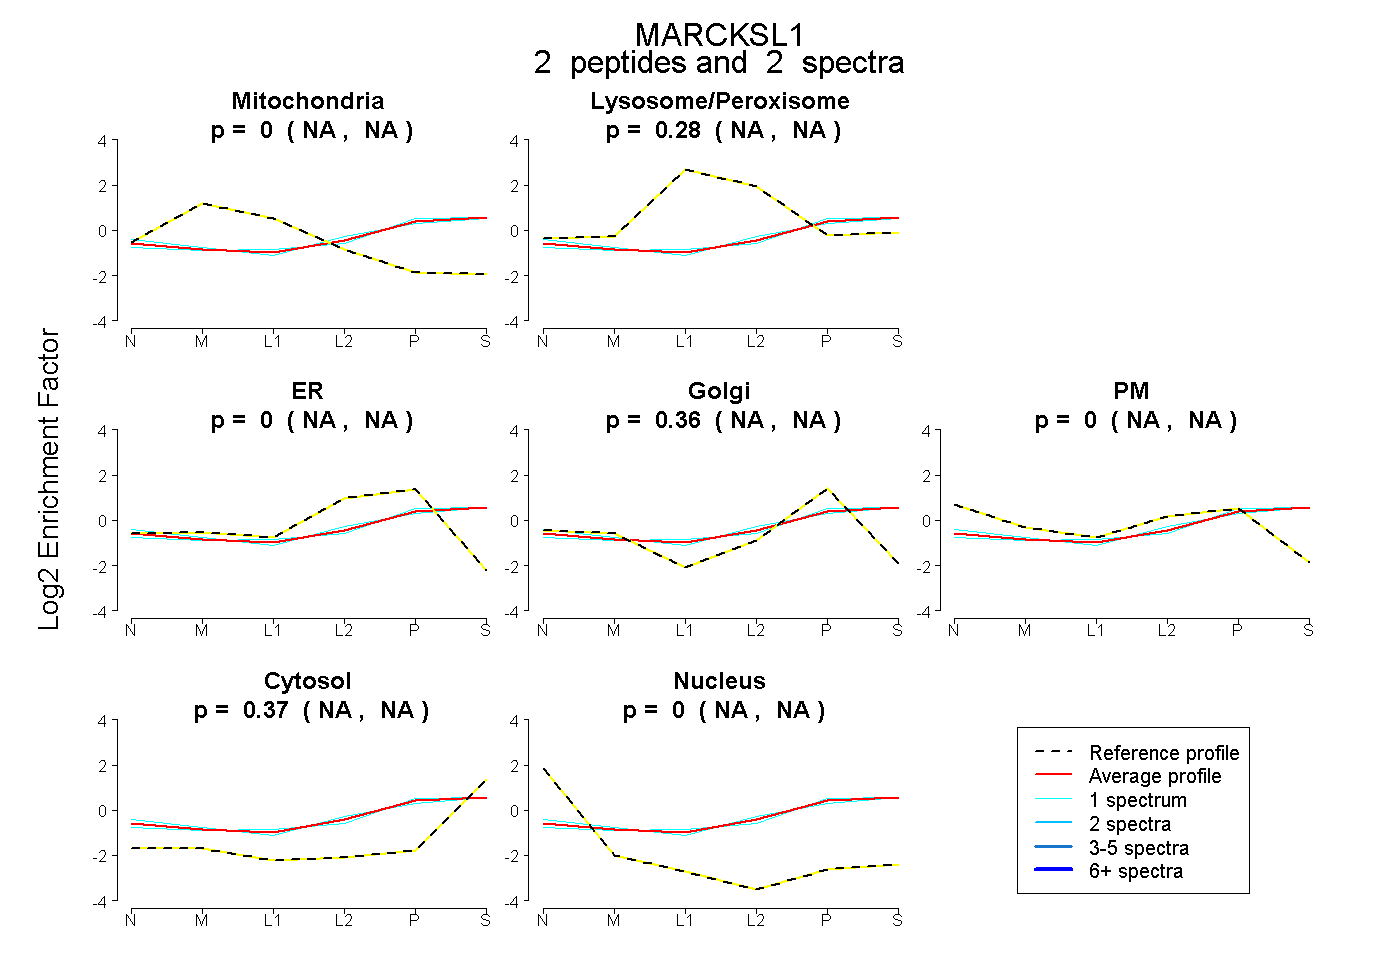 |
0.000 NA | NA |
0.277 NA | NA |
0.000 NA | NA |
0.357 NA | NA |
0.000 NA | NA |
0.366 NA | NA |
0.000 NA | NA |
|||
| Plot | Lyso | Other | |||||||||||
| Expt C |
6 peptides |
18 spectra |
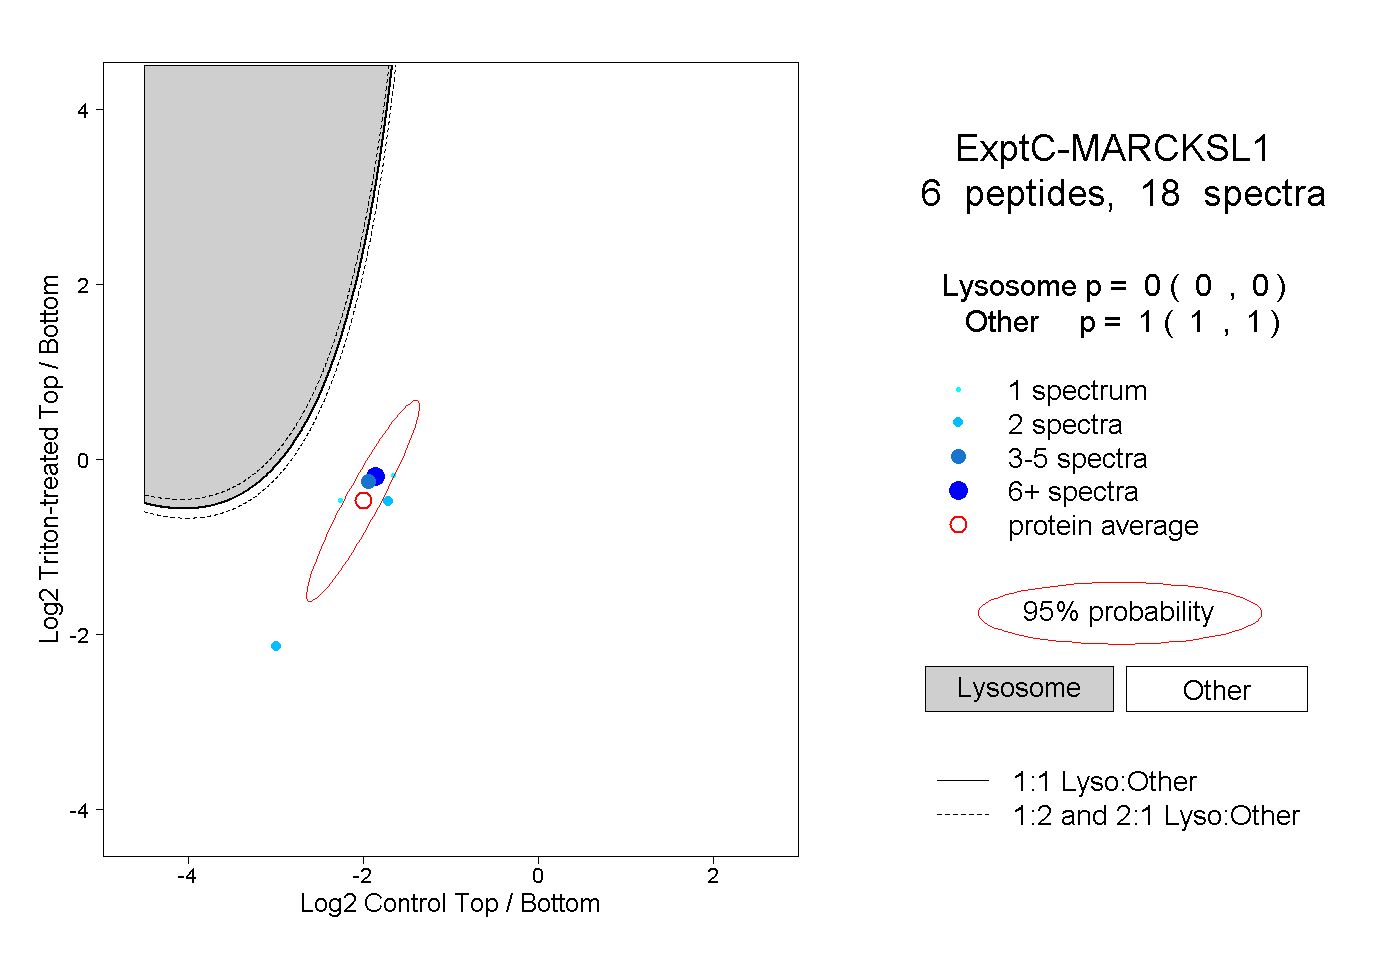 |
0.000 0.000 | 0.000 |
1.000 1.000 | 1.000 |