 13
13peptides
spectra
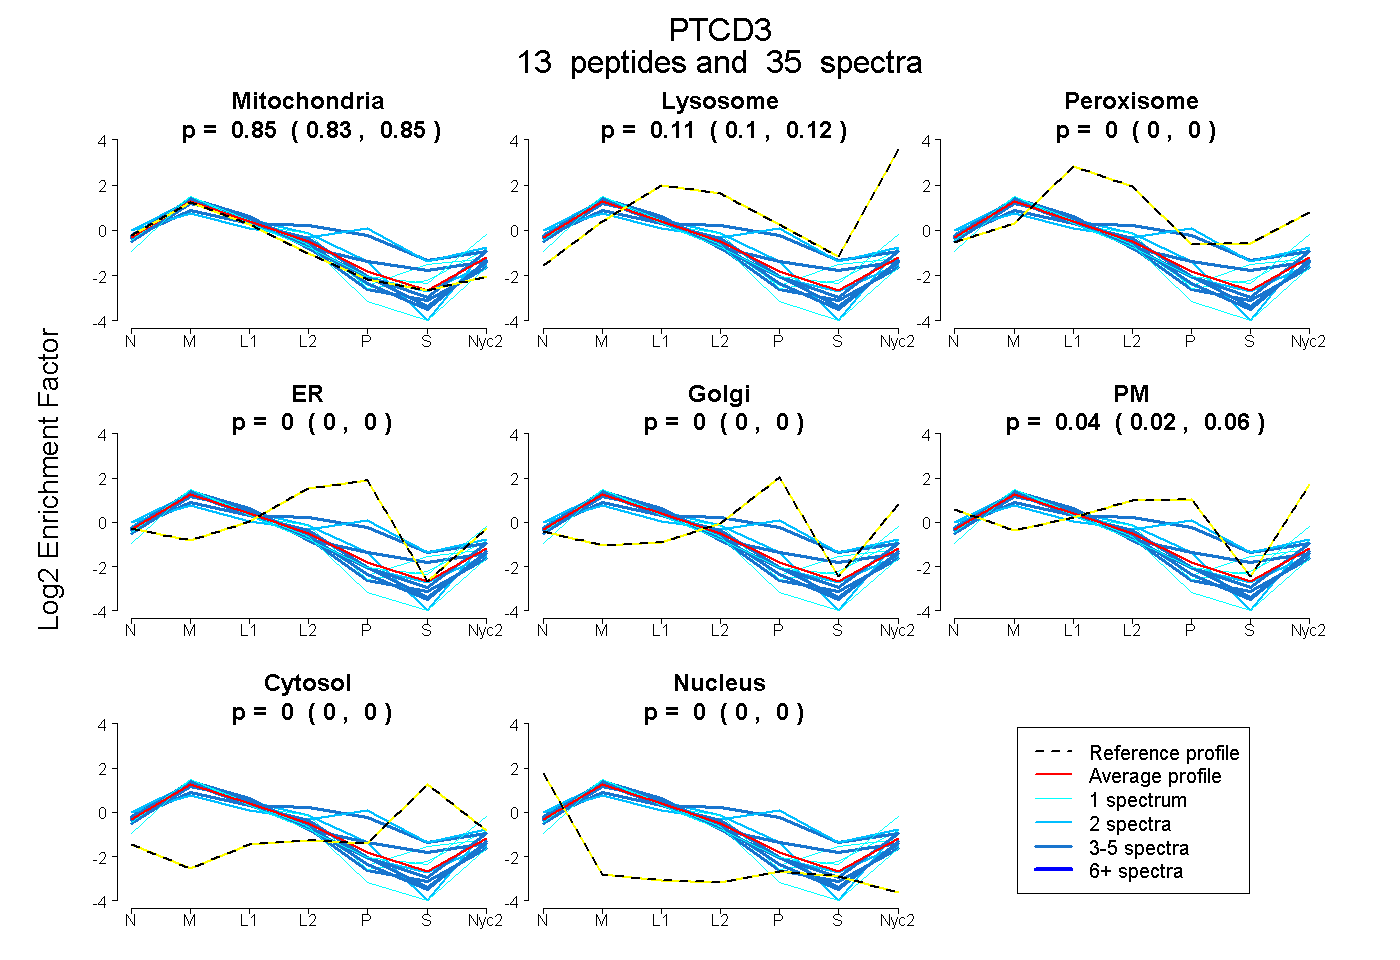
0.835 | 0.854
0.101 | 0.122
0.000 | 0.000
0.000 | 0.000
0.000 | 0.000
0.024 | 0.057
0.000 | 0.000
0.000 | 0.000
5peptides
spectra
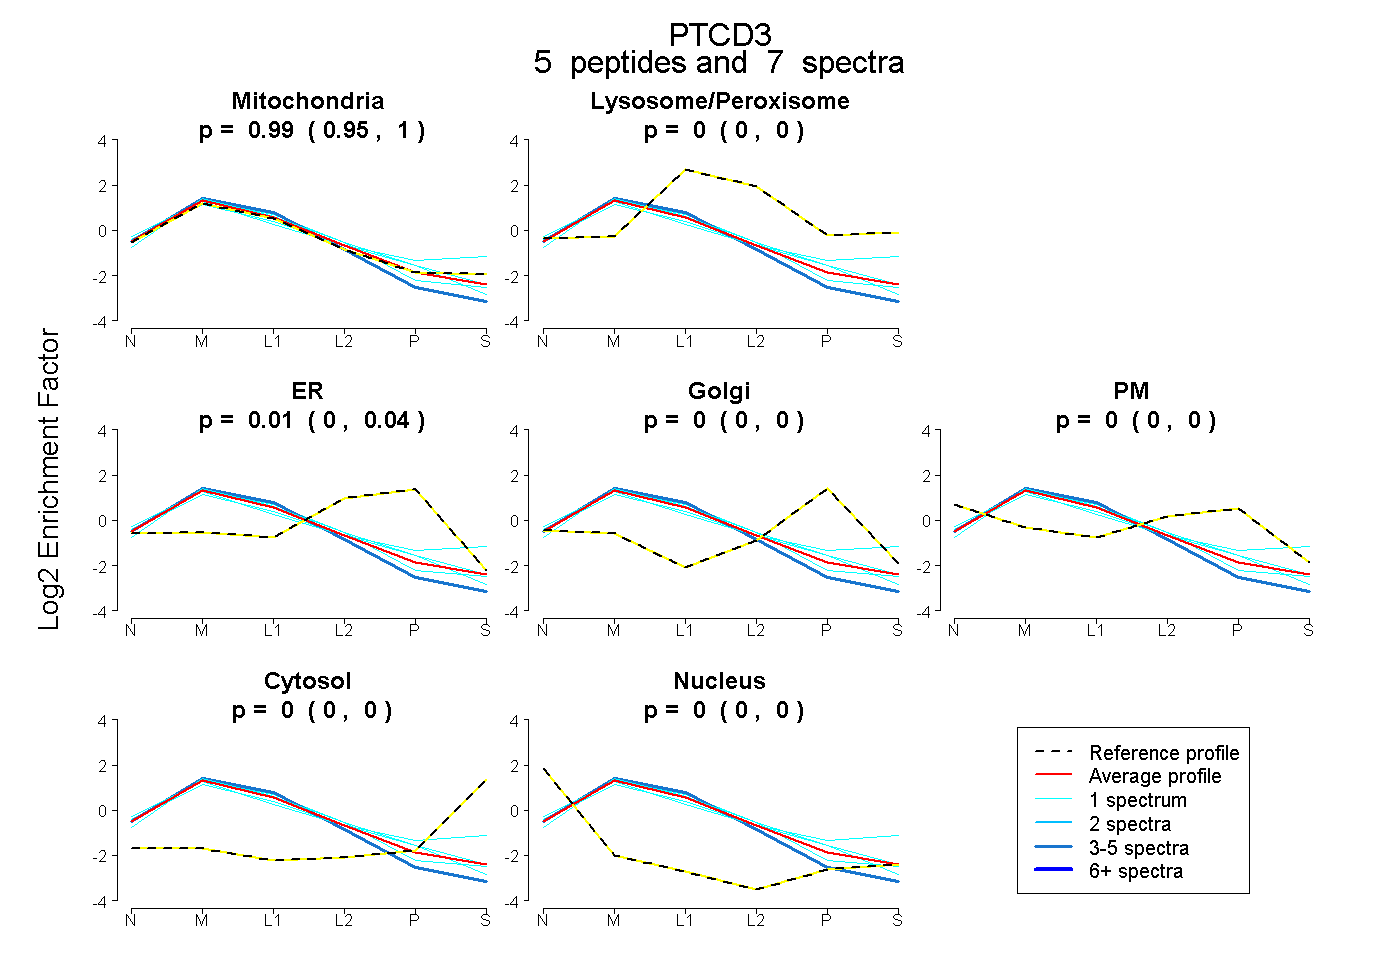
0.954 | 1.000
0.000 | 0.000
0.000 | 0.041
0.000 | 0.000
0.000 | 0.000
0.000 | 0.000
0.000 | 0.000
26peptides
spectra
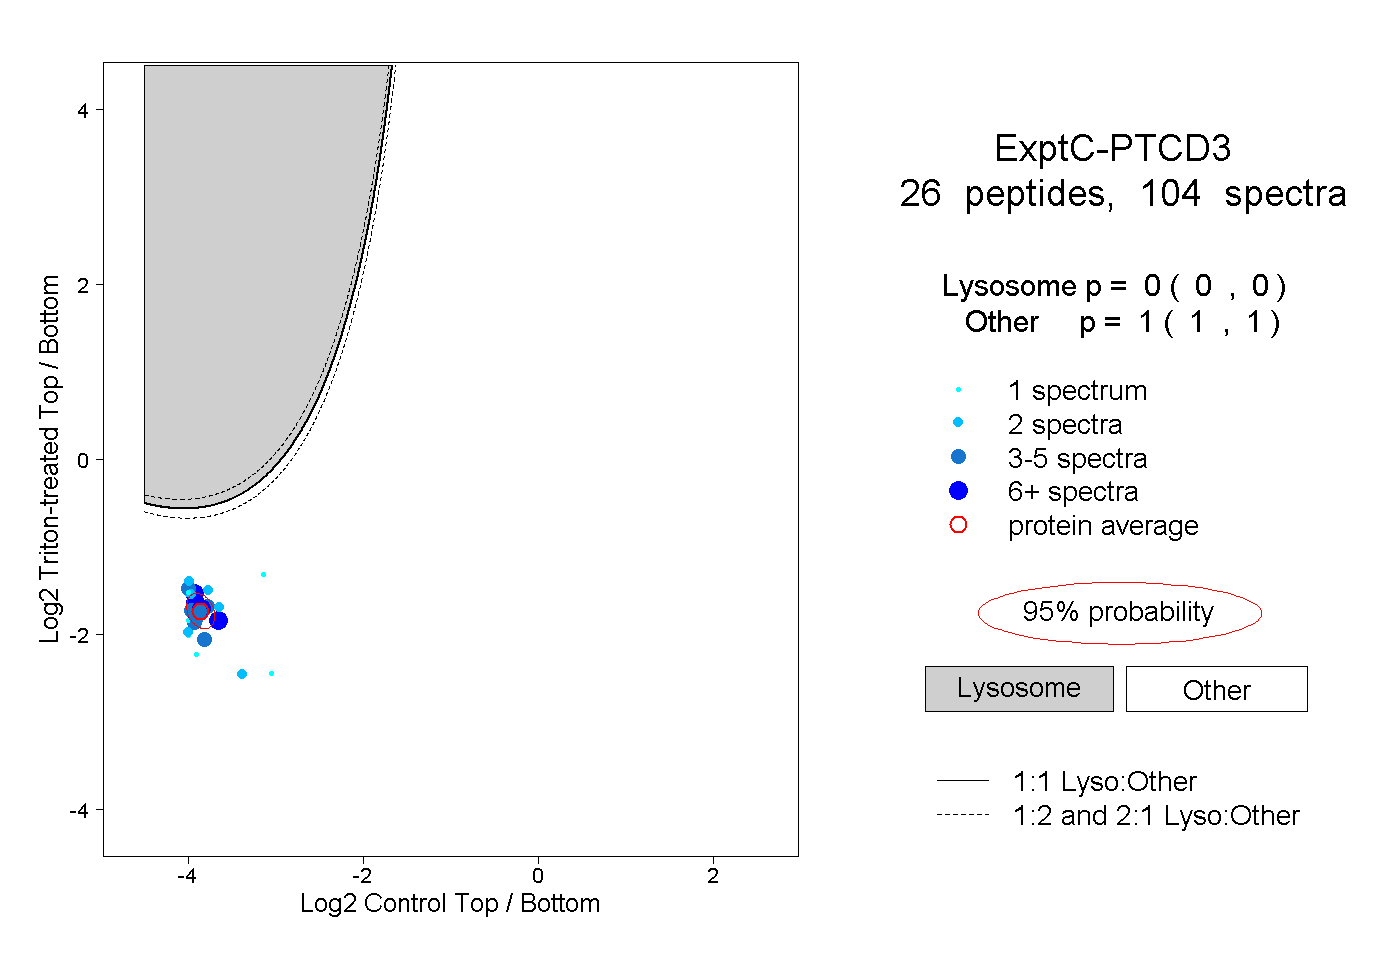
0.000 | 0.000
1.000 | 1.000
4peptides
spectra
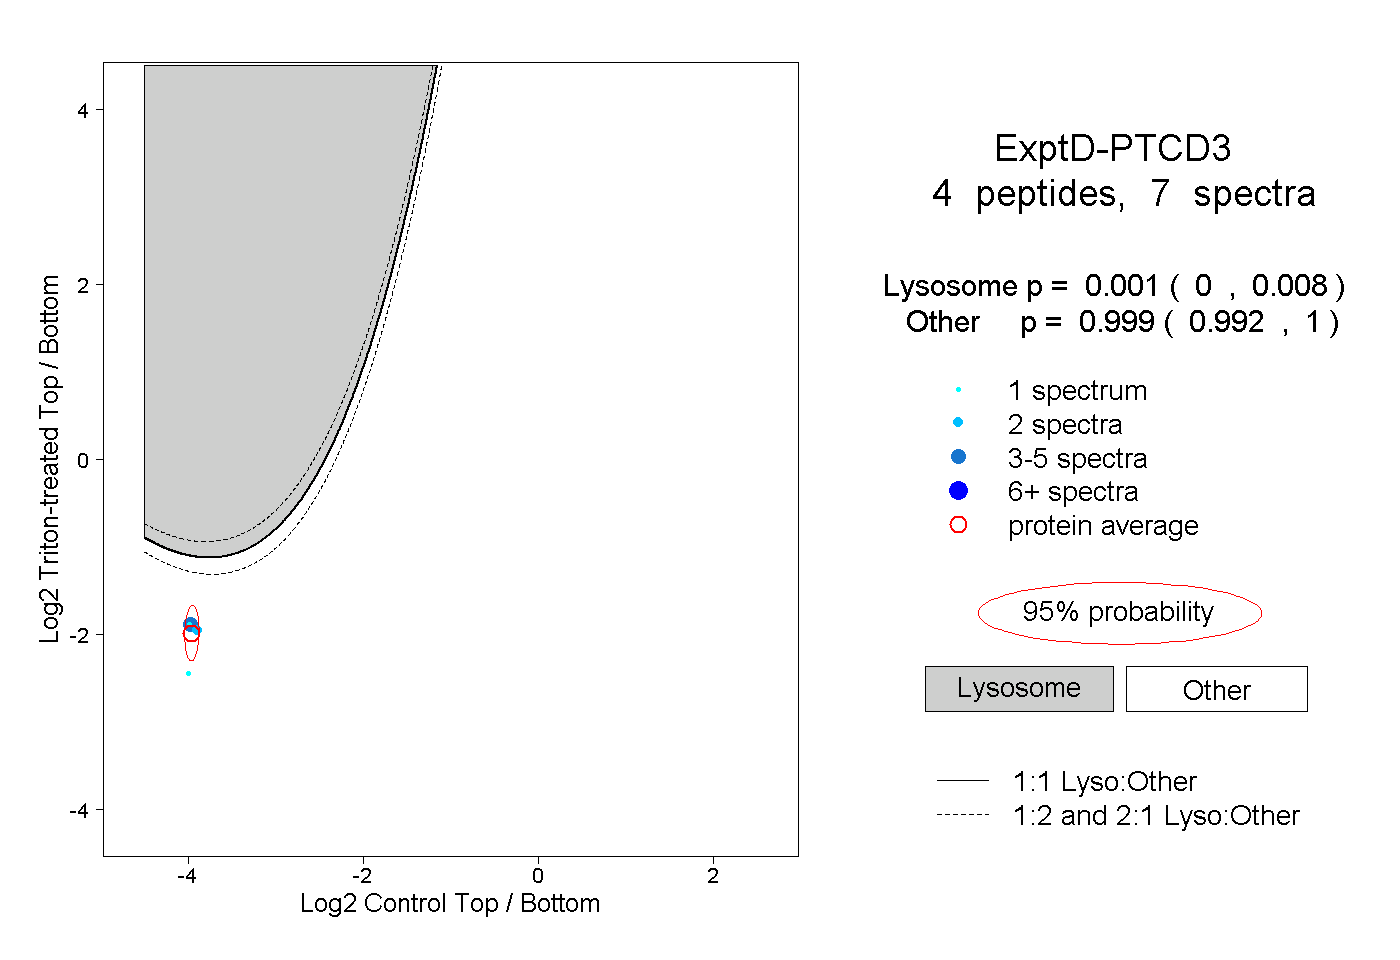
0.000 | 0.008
0.992 | 1.000