 13
13peptides
spectra
0.835 | 0.854
0.101 | 0.122
0.000 | 0.000
0.000 | 0.000
0.000 | 0.000
0.024 | 0.057
0.000 | 0.000
0.000 | 0.000
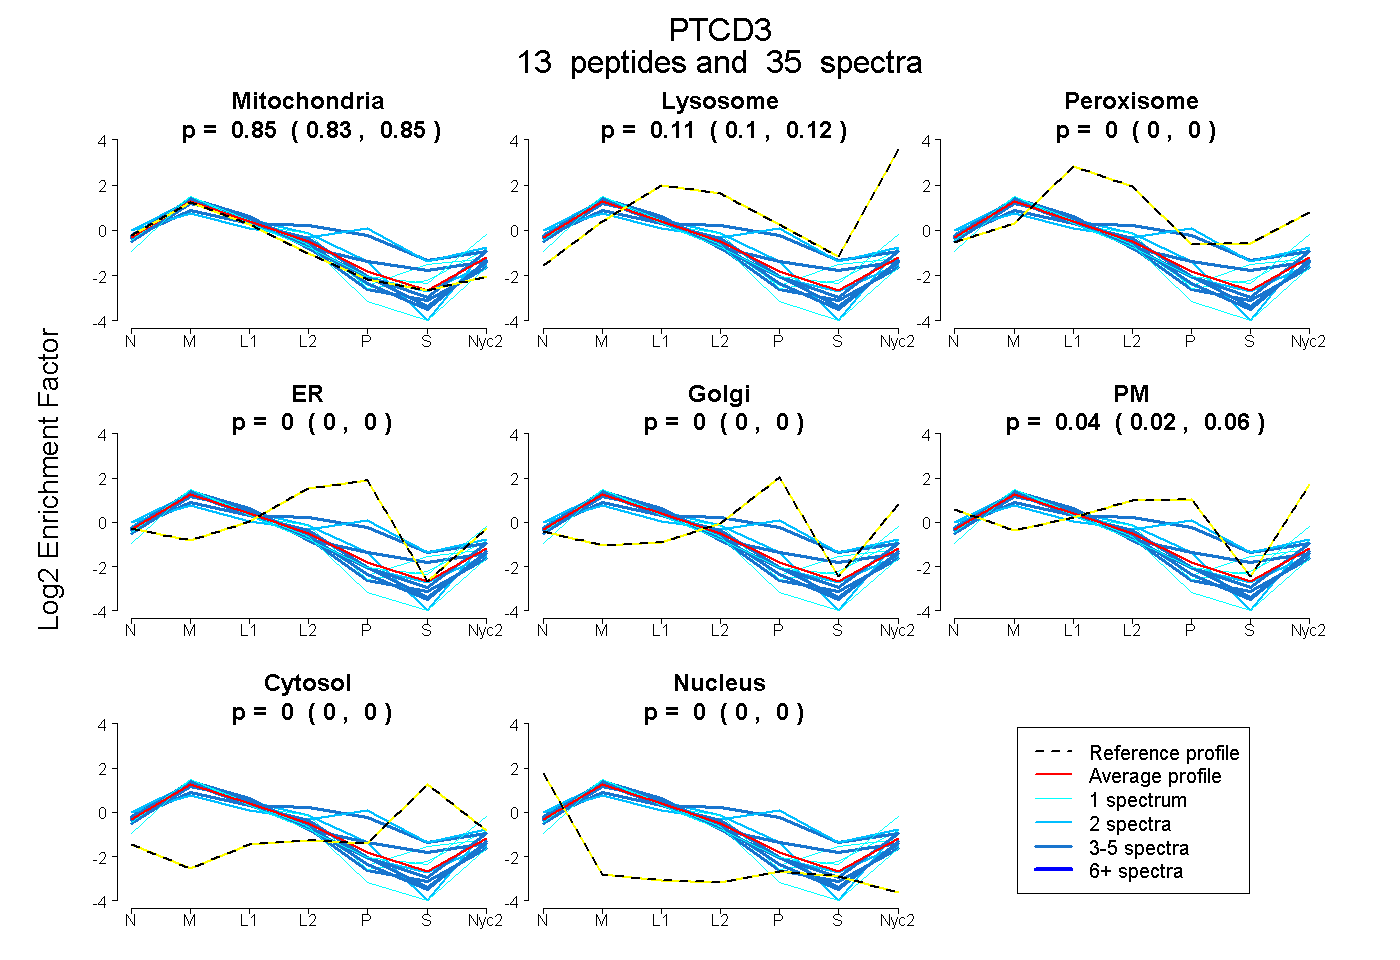
| Plot | Mito | Lyso | Perox | ER | Golgi | PM | Cytosol | Nucleus | |||||
| Expt A |
13 peptides |
35 spectra |
|
0.845 0.835 | 0.854 |
0.113 0.101 | 0.122 |
0.000 0.000 | 0.000 |
0.000 0.000 | 0.000 |
0.000 0.000 | 0.000 |
0.042 0.024 | 0.057 |
0.000 0.000 | 0.000 |
0.000 0.000 | 0.000 |
| 1 spectrum, VMMDFTVDPEQK | 0.758 | 0.242 | 0.000 | 0.000 | 0.000 | 0.000 | 0.000 | 0.000 | ||
| 3 spectra, ASSSTTLAIEVVR | 0.969 | 0.031 | 0.000 | 0.000 | 0.000 | 0.000 | 0.000 | 0.000 | ||
| 2 spectra, MESGLWK | 0.437 | 0.000 | 0.166 | 0.000 | 0.346 | 0.000 | 0.050 | 0.000 | ||
| 1 spectrum, FHSLGR | 0.827 | 0.173 | 0.000 | 0.000 | 0.000 | 0.000 | 0.000 | 0.000 | ||
| 5 spectra, NELLEEFMDTAK | 0.833 | 0.111 | 0.000 | 0.000 | 0.000 | 0.056 | 0.000 | 0.000 | ||
| 5 spectra, LPALQILR | 0.926 | 0.074 | 0.000 | 0.000 | 0.000 | 0.000 | 0.000 | 0.000 | ||
| 1 spectrum, WNDILDLLR | 1.000 | 0.000 | 0.000 | 0.000 | 0.000 | 0.000 | 0.000 | 0.000 | ||
| 2 spectra, LIGPDSQR | 0.918 | 0.064 | 0.000 | 0.000 | 0.000 | 0.018 | 0.000 | 0.000 | ||
| 2 spectra, EYGHTFR | 0.720 | 0.000 | 0.000 | 0.000 | 0.000 | 0.280 | 0.000 | 0.000 | ||
| 3 spectra, FIINSHPK | 0.439 | 0.000 | 0.217 | 0.194 | 0.082 | 0.000 | 0.068 | 0.000 | ||
| 5 spectra, SYCTMIR | 0.742 | 0.034 | 0.137 | 0.000 | 0.033 | 0.000 | 0.054 | 0.000 | ||
| 4 spectra, STYENQDAR | 0.920 | 0.067 | 0.000 | 0.000 | 0.000 | 0.013 | 0.000 | 0.000 | ||
| 1 spectrum, IFALMPEK | 0.772 | 0.038 | 0.096 | 0.000 | 0.000 | 0.000 | 0.095 | 0.000 |
| Plot | Mito | Lyso or Perox | ER | Golgi | PM | Cytosol | Nucleus | ||||||
| Expt B |
5 peptides |
7 spectra |
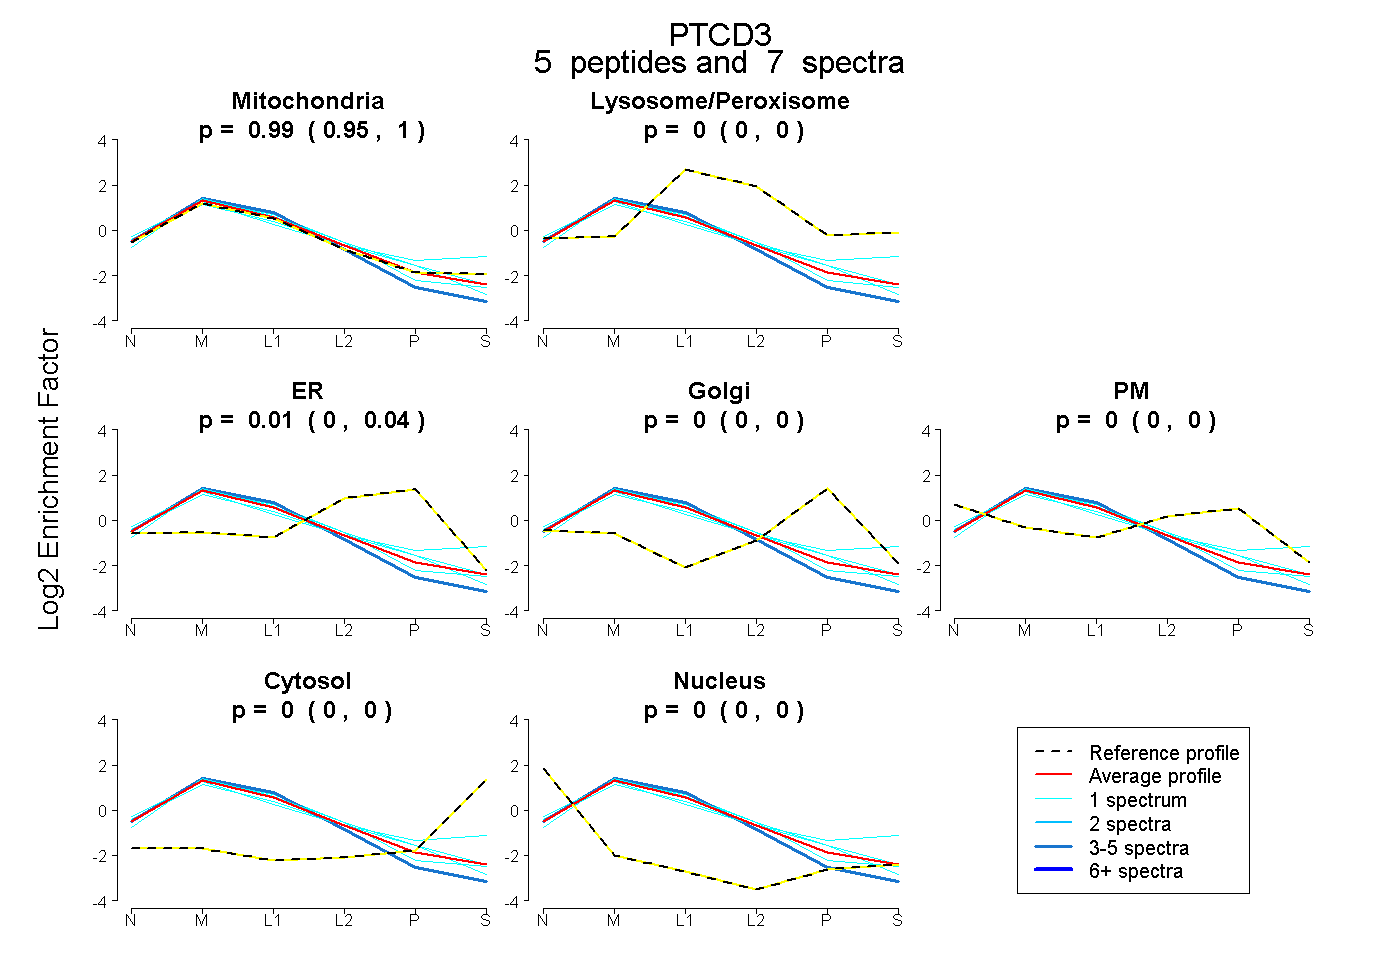 |
0.986 0.954 | 1.000 |
0.000 0.000 | 0.000 |
0.014 0.000 | 0.041 |
0.000 0.000 | 0.000 |
0.000 0.000 | 0.000 |
0.000 0.000 | 0.000 |
0.000 0.000 | 0.000 |
|||
| Plot | Lyso | Other | |||||||||||
| Expt C |
26 peptides |
104 spectra |
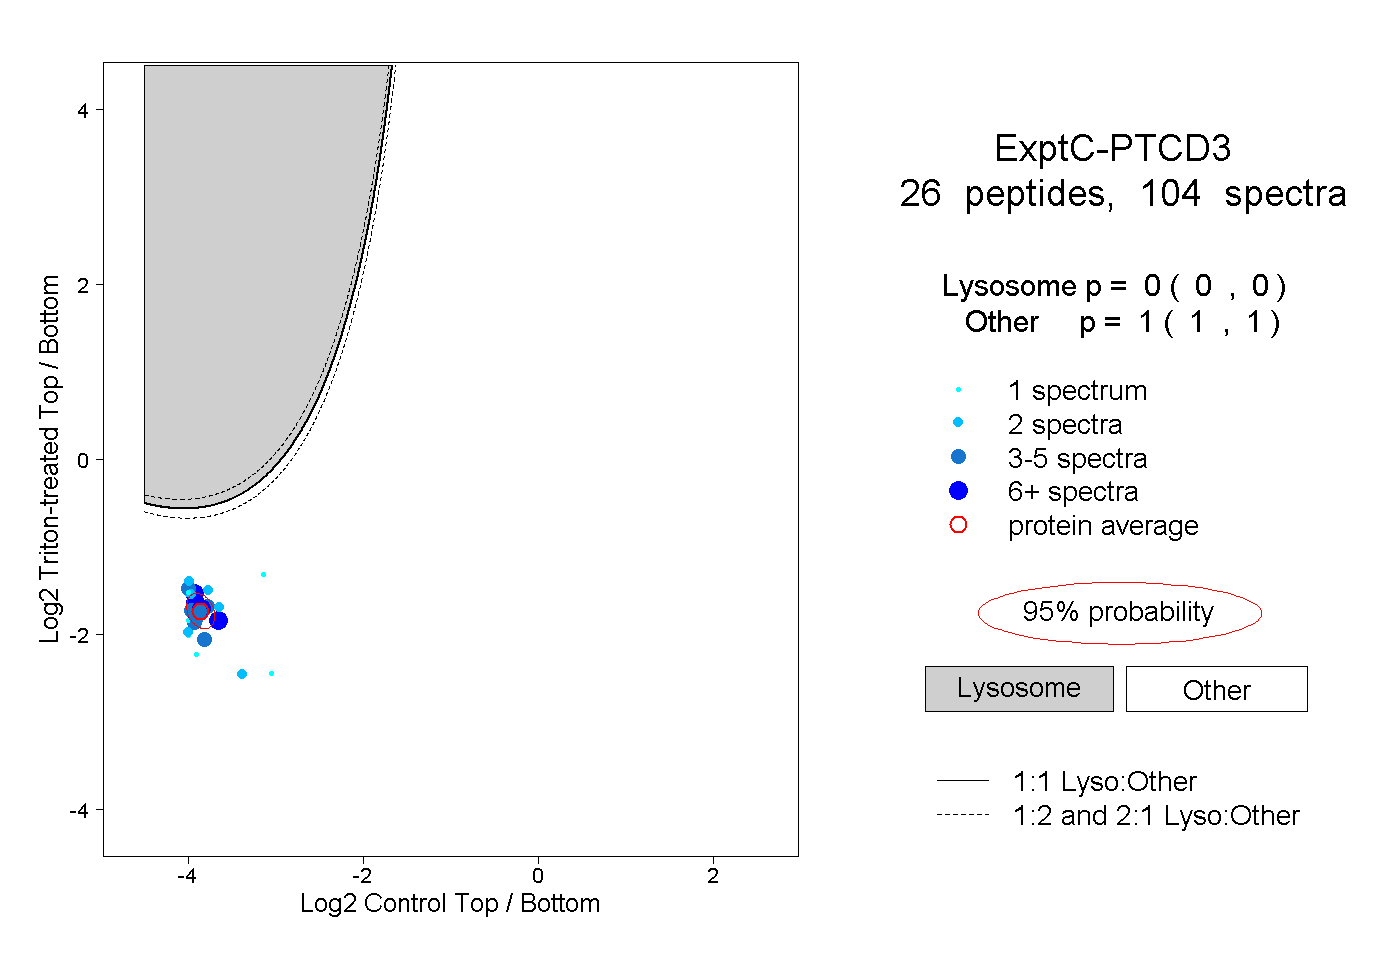 |
0.000 0.000 | 0.000 |
1.000 1.000 | 1.000 |
||||||||
| Plot | Lyso | Other | |||||||||||
| Expt D |
4 peptides |
7 spectra |
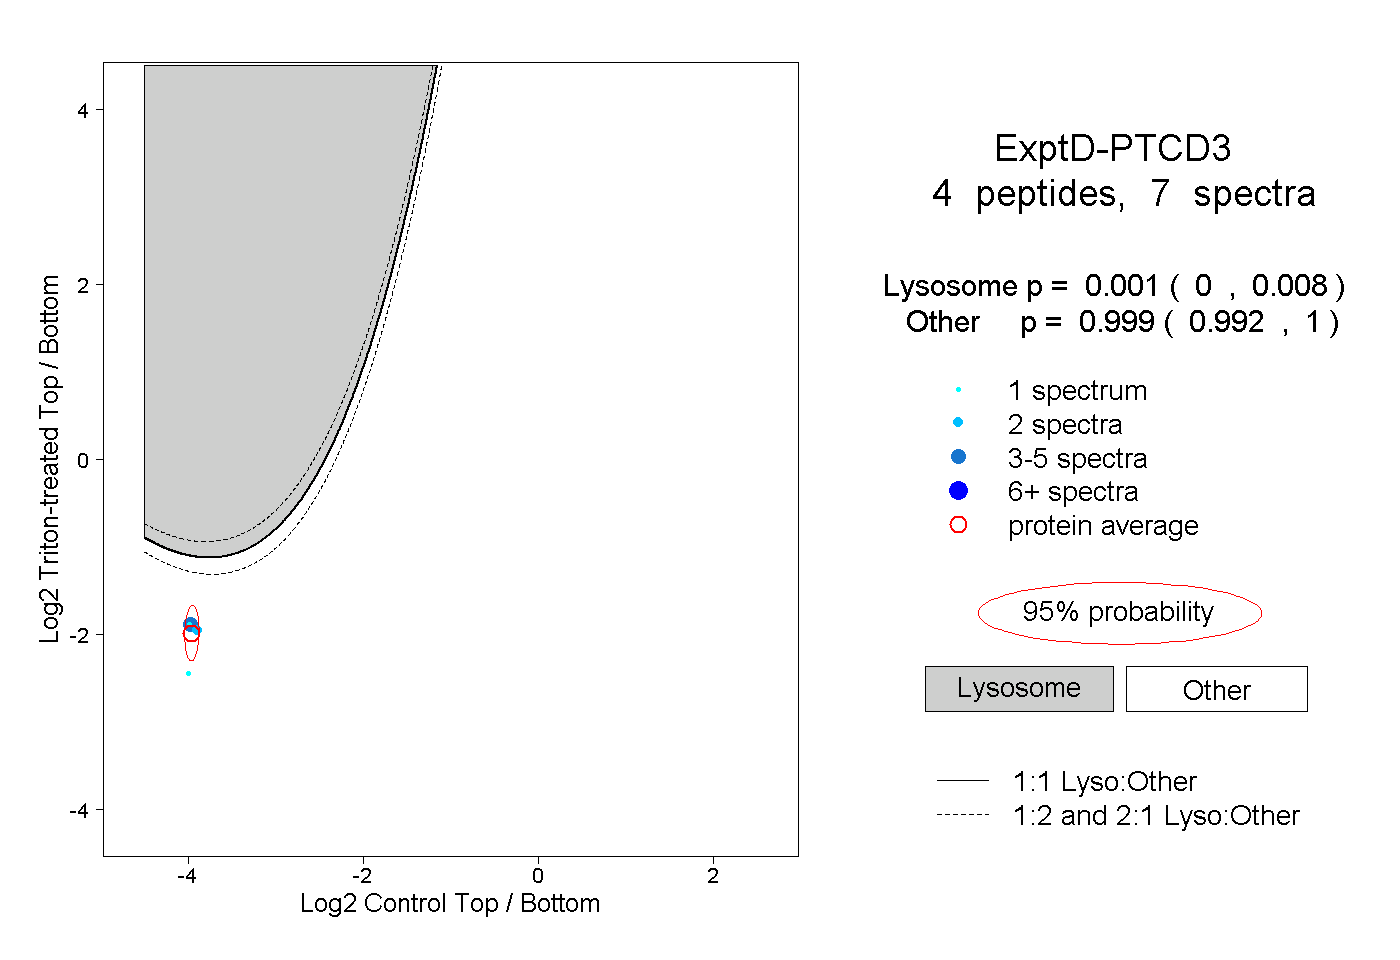 |
0.001 0.000 | 0.008 |
0.999 0.992 | 1.000 |