 11
11peptides
spectra
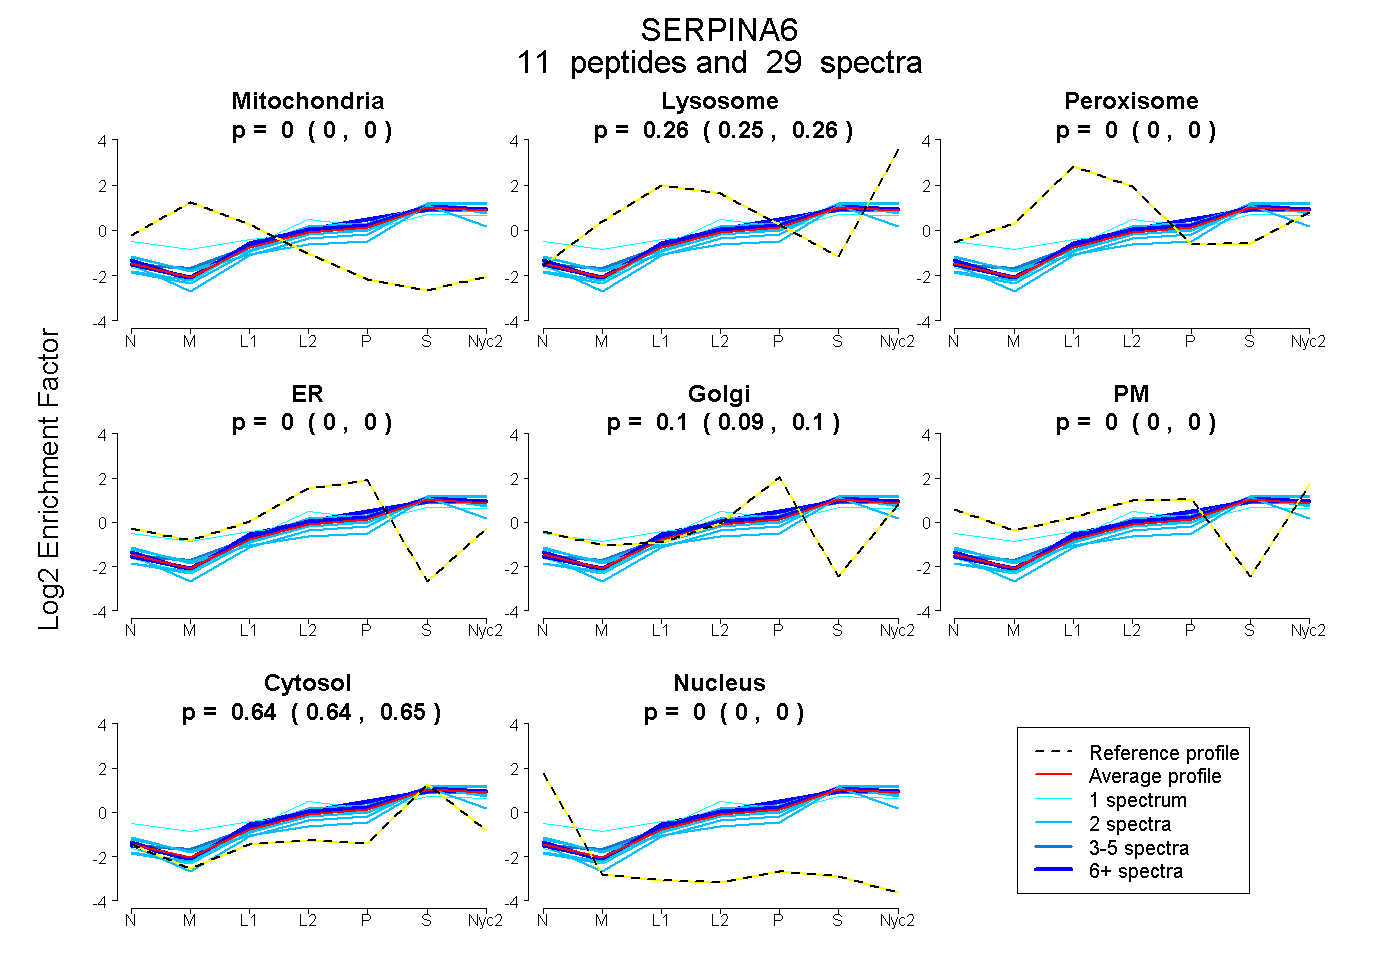
0.000 | 0.000
0.254 | 0.264
0.000 | 0.000
0.000 | 0.000
0.089 | 0.102
0.000 | 0.000
0.640 | 0.649
0.000 | 0.000
7peptides
spectra
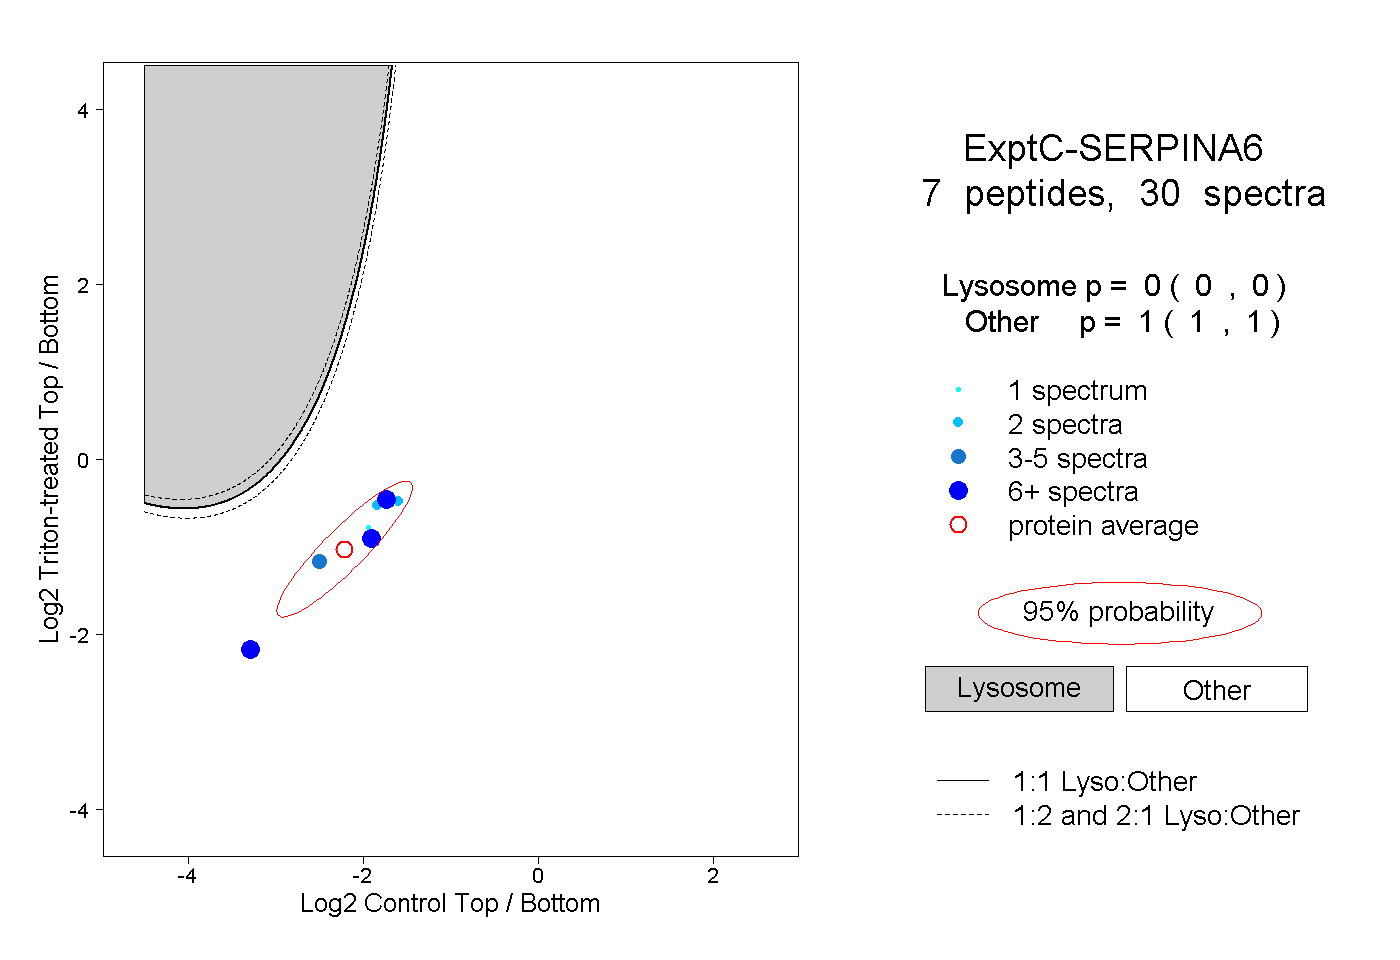
0.000 | 0.000
1.000 | 1.000
3peptides
spectra
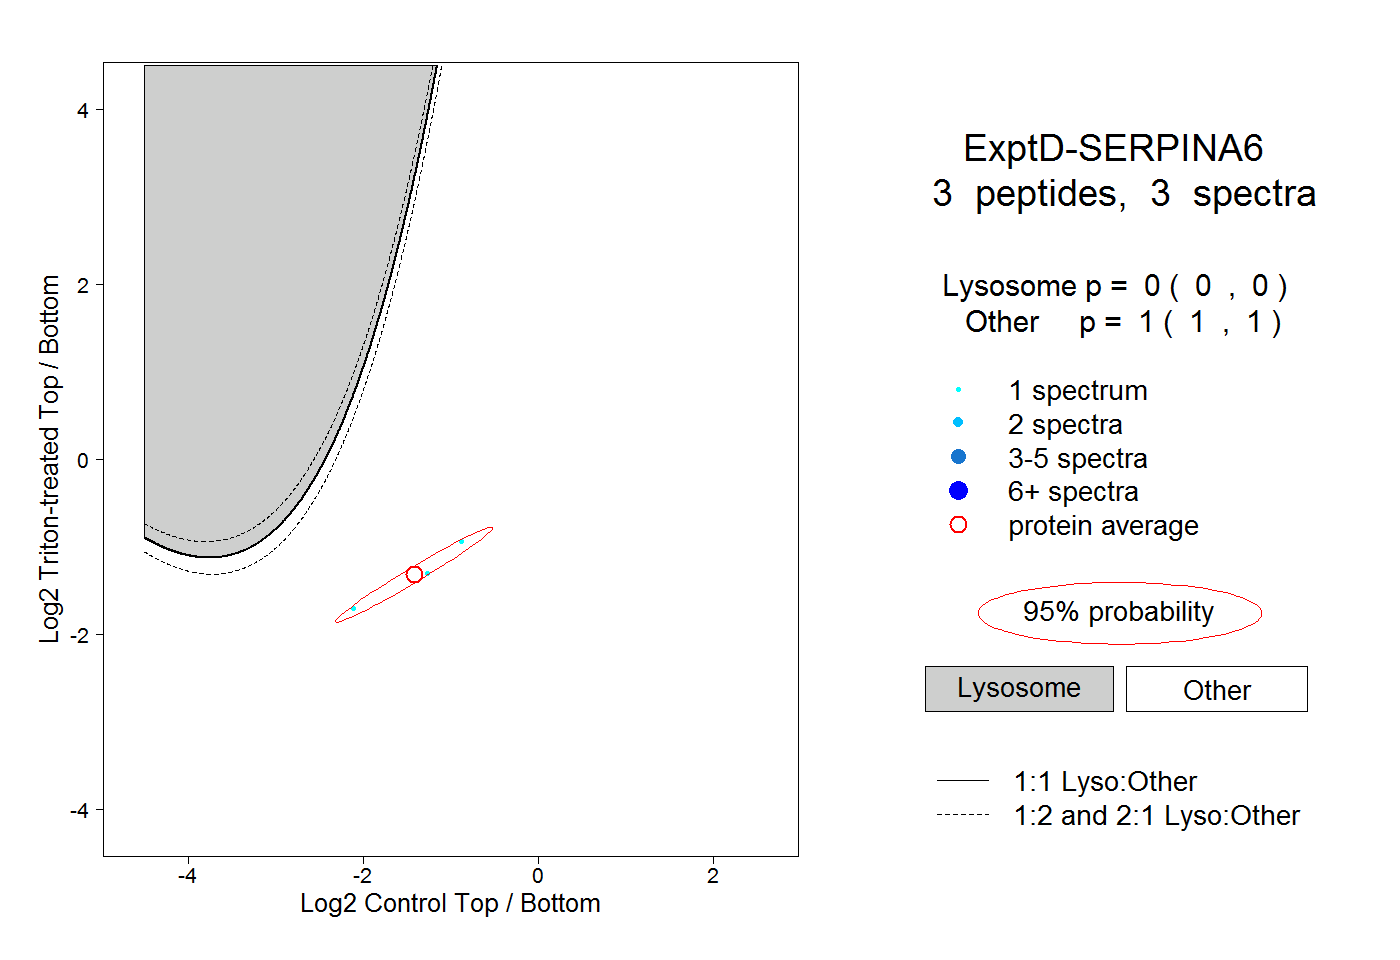
0.000 | 0.000
1.000 | 1.000