 11
11peptides
spectra
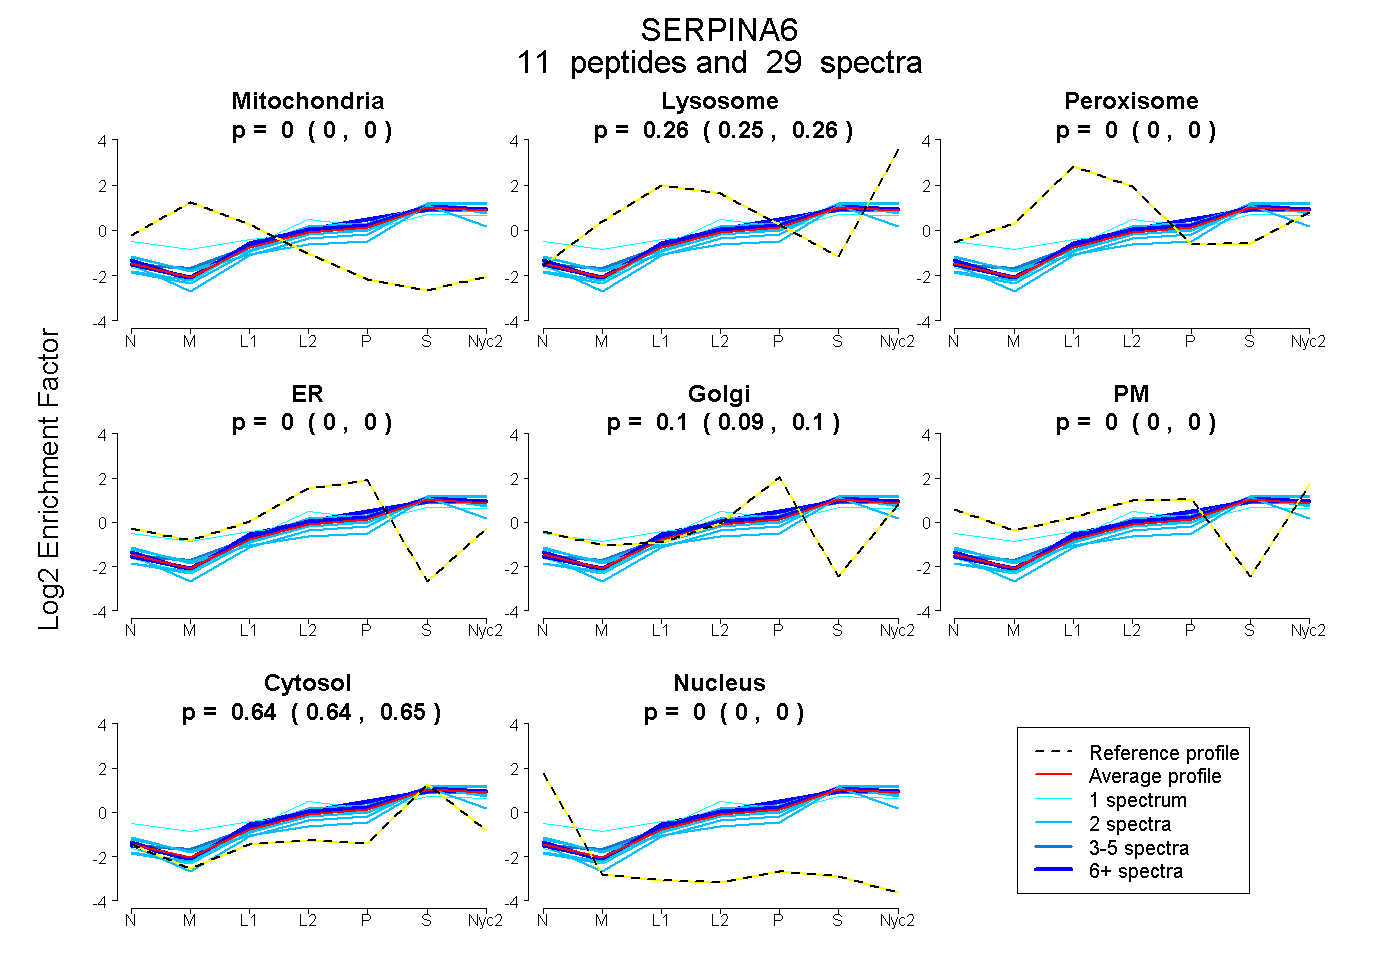
0.000 | 0.000
0.254 | 0.264
0.000 | 0.000
0.000 | 0.000
0.089 | 0.102
0.000 | 0.000
0.640 | 0.649
0.000 | 0.000
| Plot | Mito | Lyso | Perox | ER | Golgi | PM | Cytosol | Nucleus | |||||
| Expt A |
11 peptides |
29 spectra |
|
0.000 0.000 | 0.000 |
0.260 0.254 | 0.264 |
0.000 0.000 | 0.000 |
0.000 0.000 | 0.000 |
0.096 0.089 | 0.102 |
0.000 0.000 | 0.000 |
0.645 0.640 | 0.649 |
0.000 0.000 | 0.000 |
| 2 spectra, VPMMVQSGSIGYFR | 0.000 | 0.156 | 0.000 | 0.000 | 0.082 | 0.000 | 0.762 | 0.000 | ||
| 7 spectra, SEPLDIK | 0.000 | 0.289 | 0.000 | 0.000 | 0.082 | 0.000 | 0.629 | 0.000 | ||
| 2 spectra, QVNLYIPK | 0.000 | 0.312 | 0.000 | 0.000 | 0.064 | 0.000 | 0.623 | 0.000 | ||
| 1 spectrum, DSFLADVK | 0.000 | 0.243 | 0.000 | 0.000 | 0.104 | 0.000 | 0.653 | 0.000 | ||
| 6 spectra, DVPLTLTMVHK | 0.000 | 0.260 | 0.000 | 0.000 | 0.151 | 0.000 | 0.589 | 0.000 | ||
| 1 spectrum, GLAPTNVDFAFNLYQR | 0.000 | 0.328 | 0.000 | 0.000 | 0.046 | 0.000 | 0.626 | 0.000 | ||
| 2 spectra, GIWELPFSPENTR | 0.000 | 0.284 | 0.000 | 0.000 | 0.024 | 0.000 | 0.692 | 0.000 | ||
| 2 spectra, LVALNPDK | 0.000 | 0.180 | 0.000 | 0.000 | 0.069 | 0.000 | 0.751 | 0.000 | ||
| 1 spectrum, FSISDTYDLK | 0.000 | 0.161 | 0.057 | 0.000 | 0.000 | 0.235 | 0.547 | 0.000 | ||
| 3 spectra, ASQQINQHVK | 0.000 | 0.266 | 0.000 | 0.000 | 0.156 | 0.000 | 0.578 | 0.000 | ||
| 2 spectra, DMLEDLNIK | 0.000 | 0.257 | 0.000 | 0.000 | 0.100 | 0.000 | 0.642 | 0.000 |
| Plot | Lyso | Other | |||||||||||
| Expt C |
7 peptides |
30 spectra |
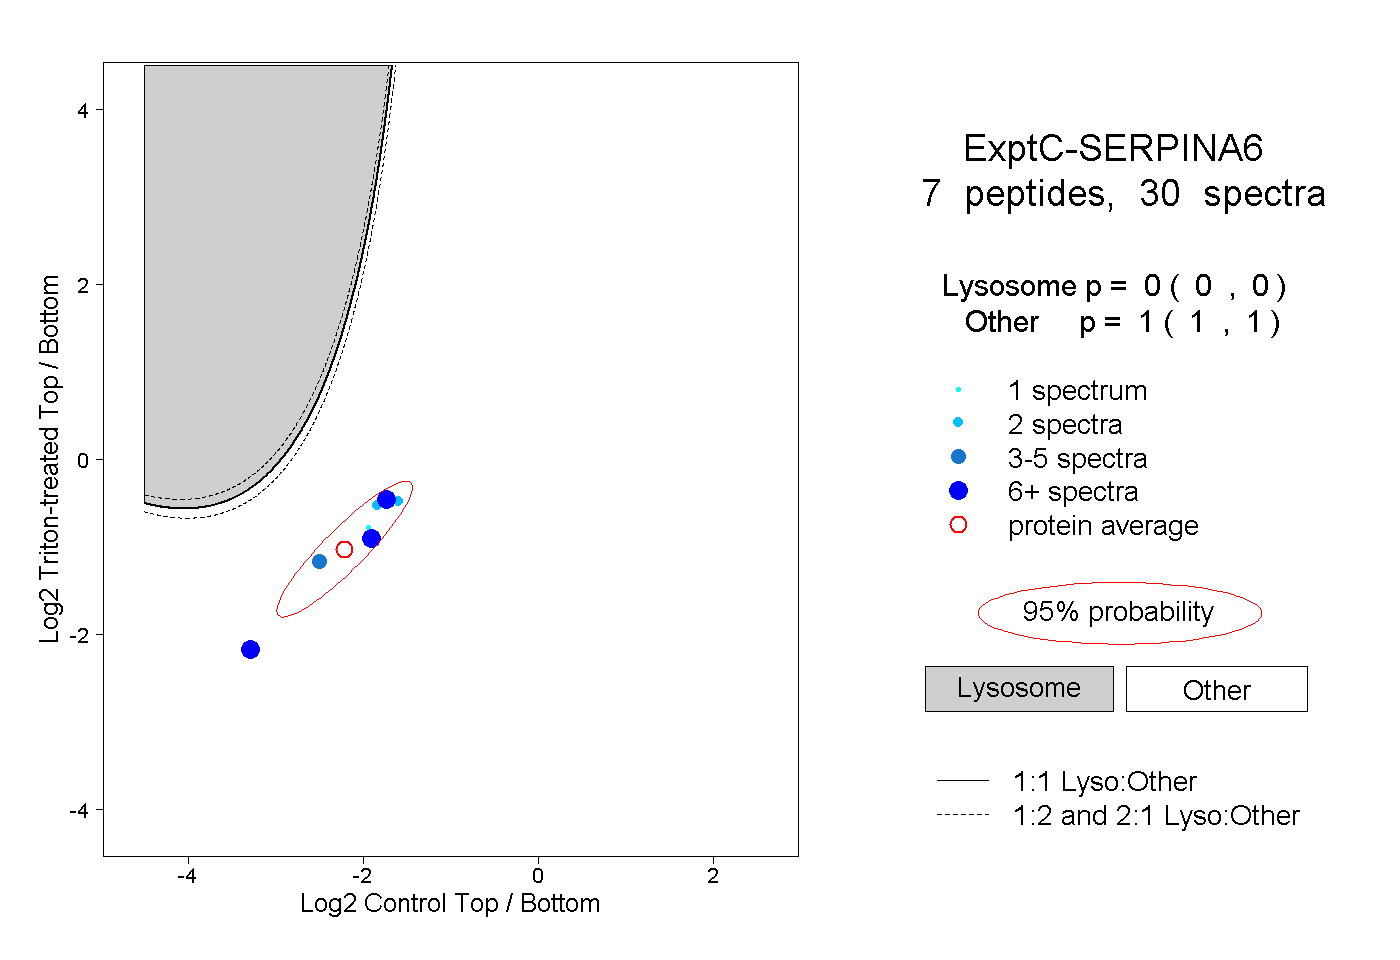 |
0.000 0.000 | 0.000 |
1.000 1.000 | 1.000 |
||||||||
| Plot | Lyso | Other | |||||||||||
| Expt D |
3 peptides |
3 spectra |
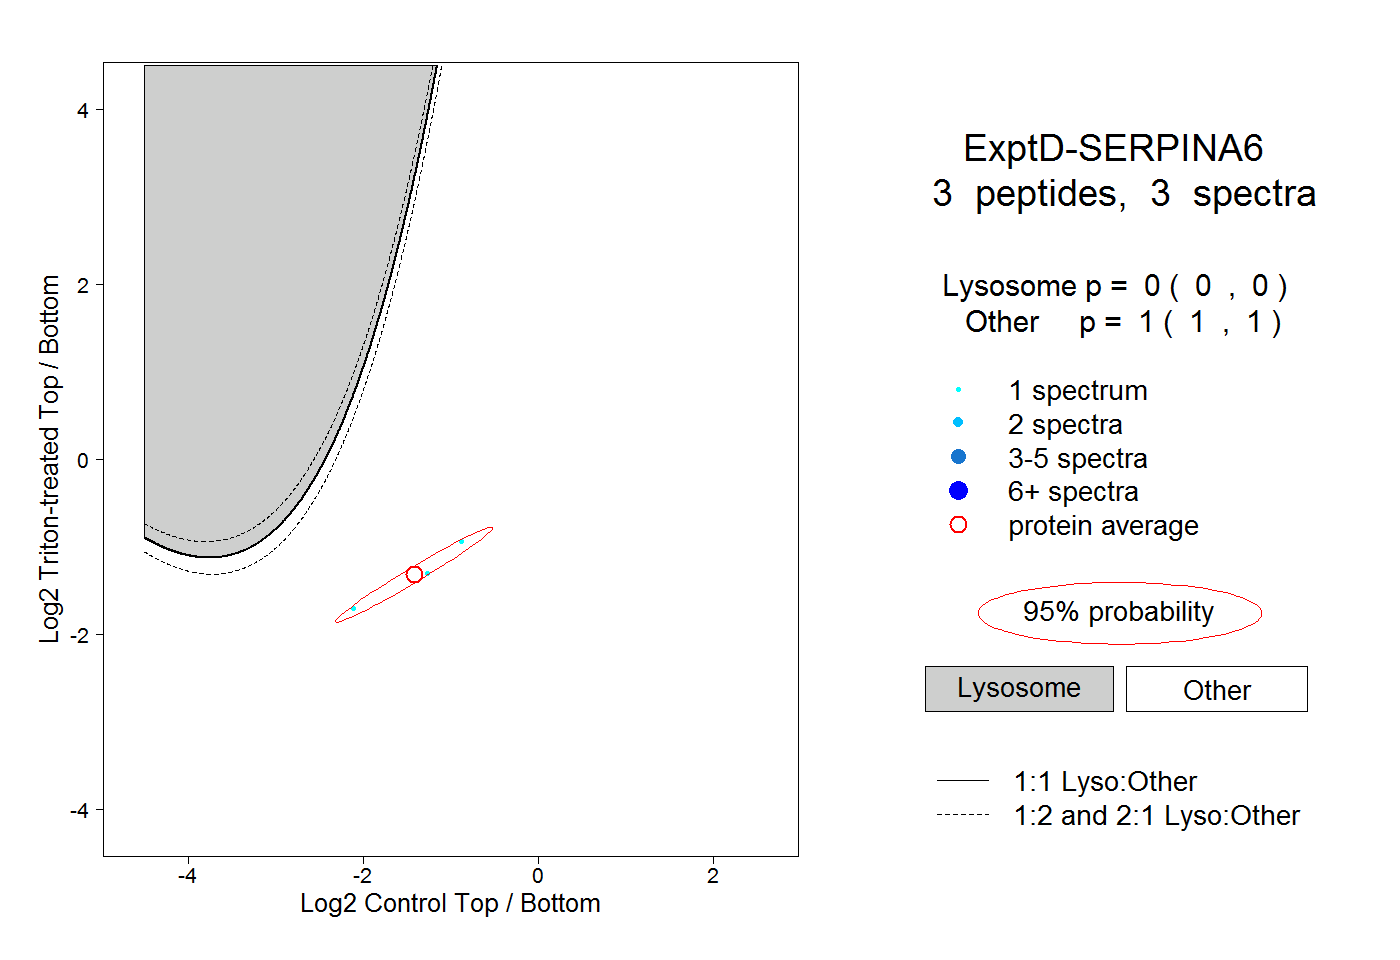 |
0.000 0.000 | 0.000 |
1.000 1.000 | 1.000 |