 5
5peptides
spectra
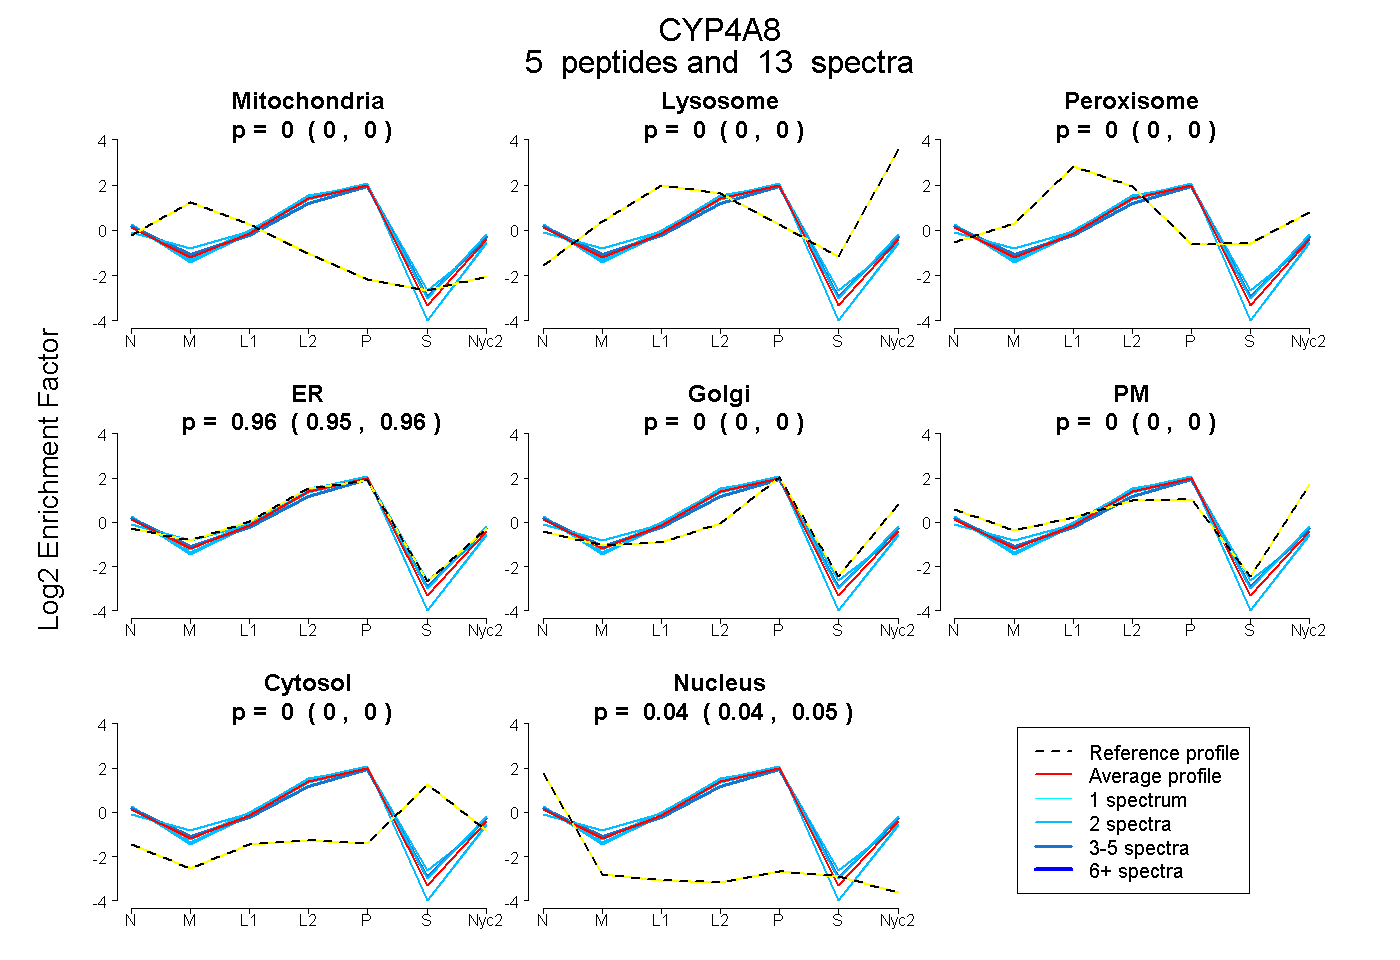
0.000 | 0.000
0.000 | 0.000
0.000 | 0.000
0.952 | 0.959
0.000 | 0.000
0.000 | 0.000
0.000 | 0.000
0.040 | 0.047
4peptides
spectra
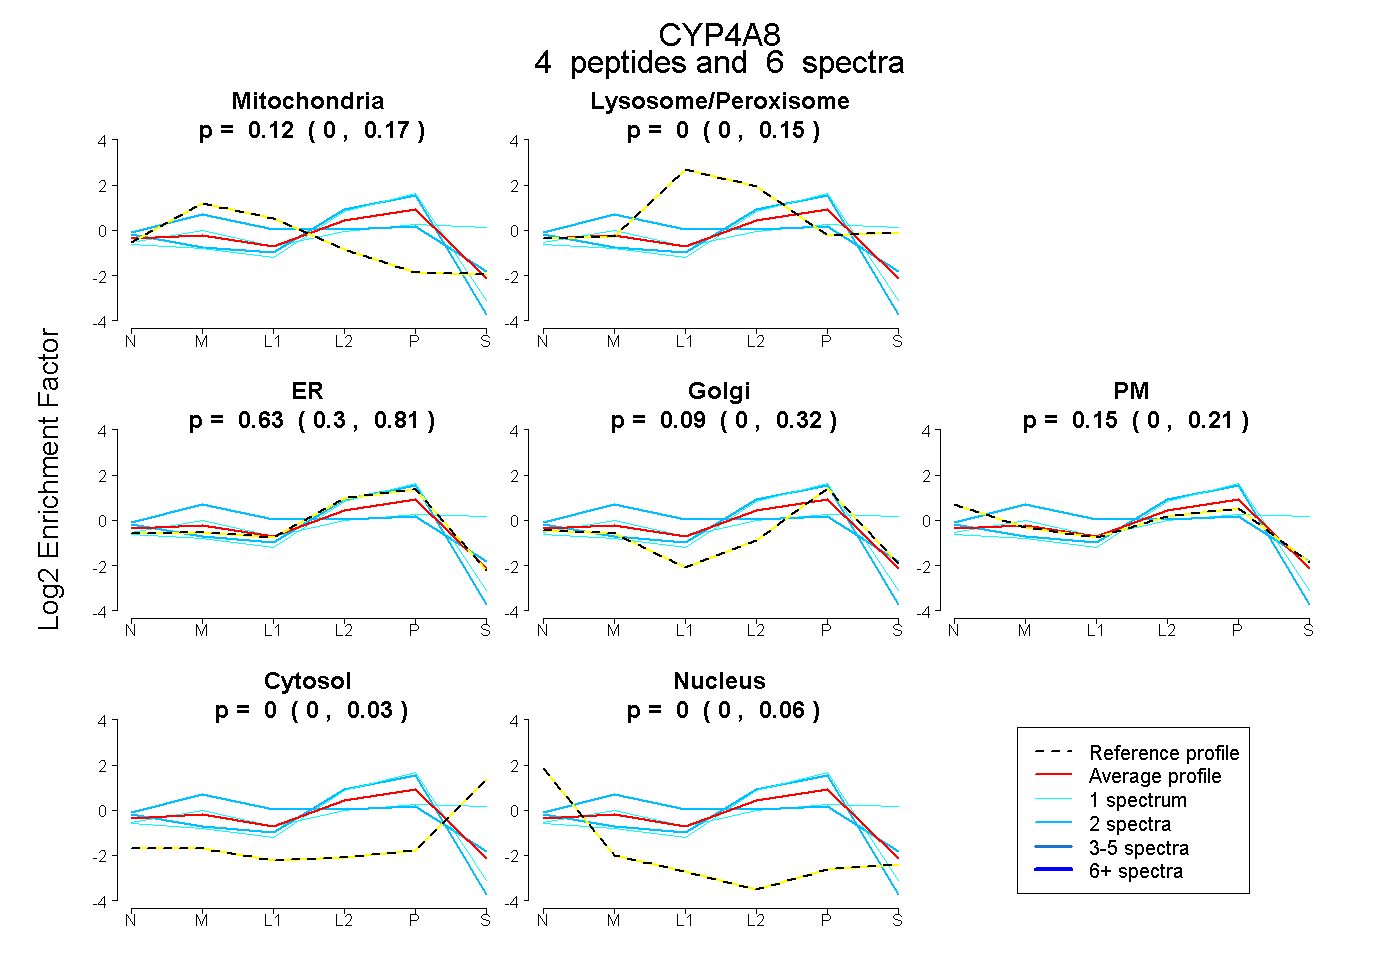
0.000 | 0.174
0.000 | 0.153
0.298 | 0.809
0.000 | 0.322
0.000 | 0.206
0.000 | 0.034
0.000 | 0.056
5peptides
spectra
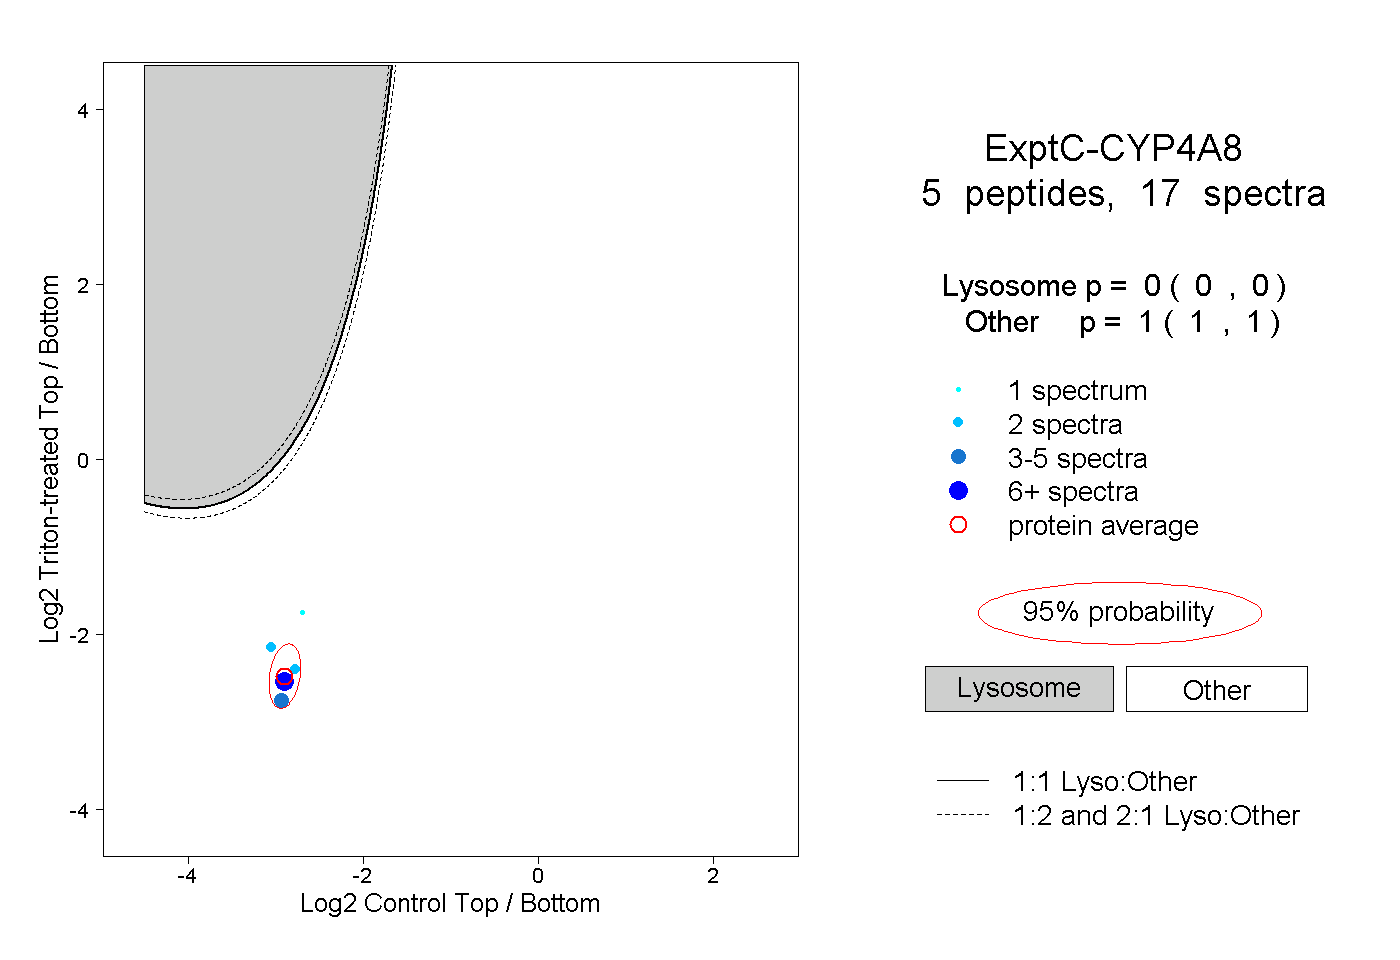
0.000 | 0.000
1.000 | 1.000
1peptide
spectrum
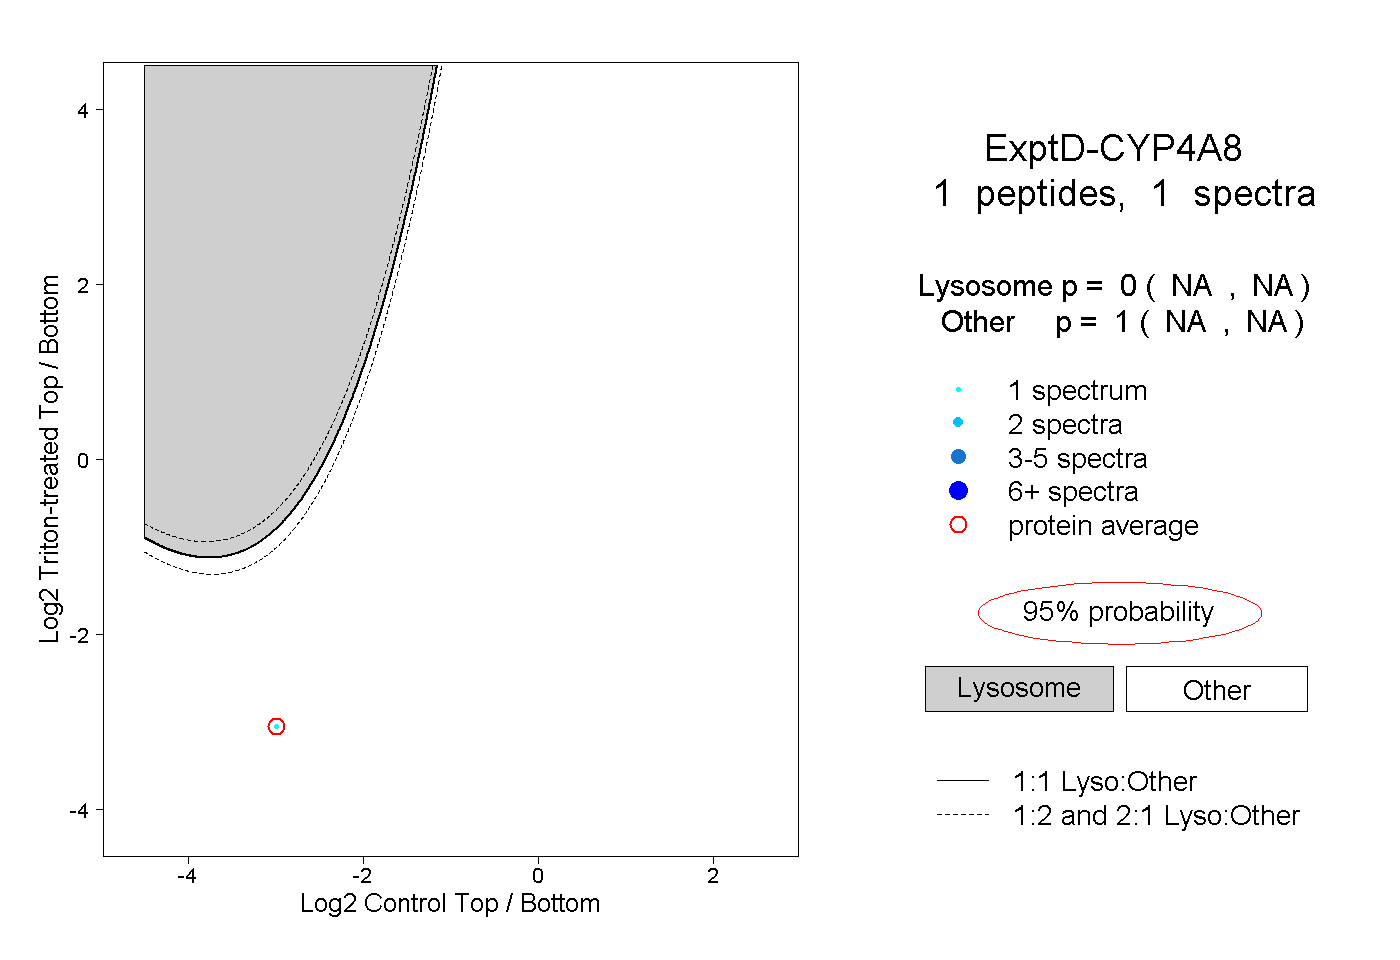
NA | NA
NA | NA