 5
5peptides
spectra
0.000 | 0.000
0.000 | 0.000
0.000 | 0.000
0.952 | 0.959
0.000 | 0.000
0.000 | 0.000
0.000 | 0.000
0.040 | 0.047
| Plot | Mito | Lyso | Perox | ER | Golgi | PM | Cytosol | Nucleus | |||||
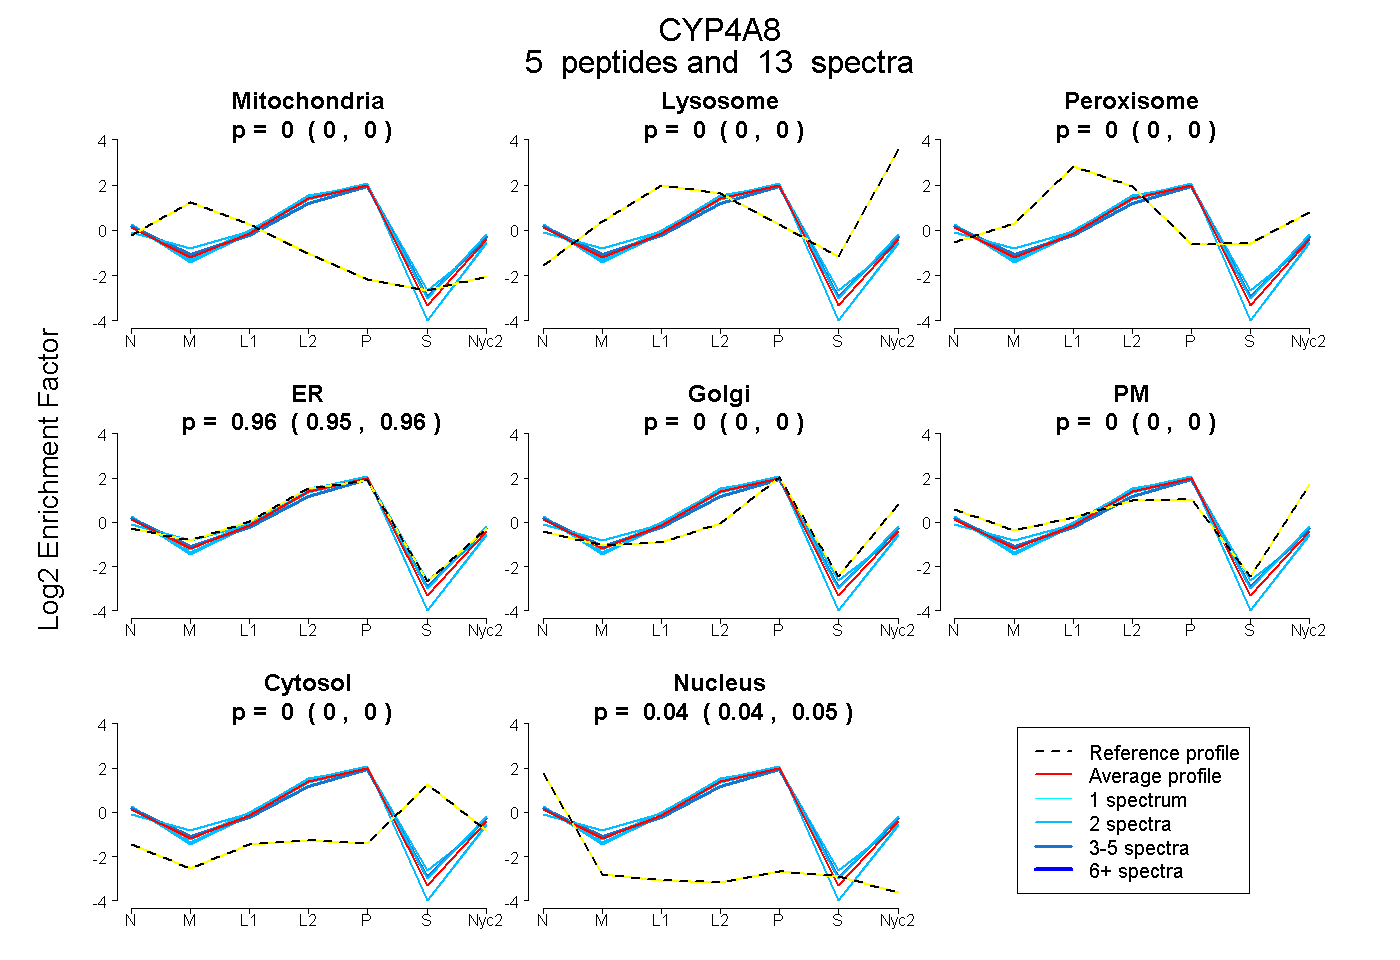
| Expt A |
5 peptides |
13 spectra |
|
0.000 0.000 | 0.000 |
0.000 0.000 | 0.000 |
0.000 0.000 | 0.000 |
0.956 0.952 | 0.959 |
0.000 0.000 | 0.000 |
0.000 0.000 | 0.000 |
0.000 0.000 | 0.000 |
0.044 0.040 | 0.047 |
| 2 spectra, DQEFQDILTR | 0.000 | 0.000 | 0.000 | 0.943 | 0.000 | 0.000 | 0.000 | 0.057 | ||
| 2 spectra, AVEDLNNLSFFR | 0.000 | 0.000 | 0.000 | 0.959 | 0.000 | 0.000 | 0.000 | 0.041 | ||
| 2 spectra, MLSTPVTFPDGR | 0.000 | 0.000 | 0.000 | 0.965 | 0.007 | 0.025 | 0.000 | 0.003 | ||
| 2 spectra, IPIPIPR | 0.000 | 0.000 | 0.000 | 0.945 | 0.000 | 0.000 | 0.000 | 0.055 | ||
| 5 spectra, IYPPVTAVSR | 0.000 | 0.000 | 0.000 | 0.847 | 0.092 | 0.012 | 0.000 | 0.049 |
| Plot | Mito | Lyso or Perox | ER | Golgi | PM | Cytosol | Nucleus | ||||||
| Expt B |
4 peptides |
6 spectra |
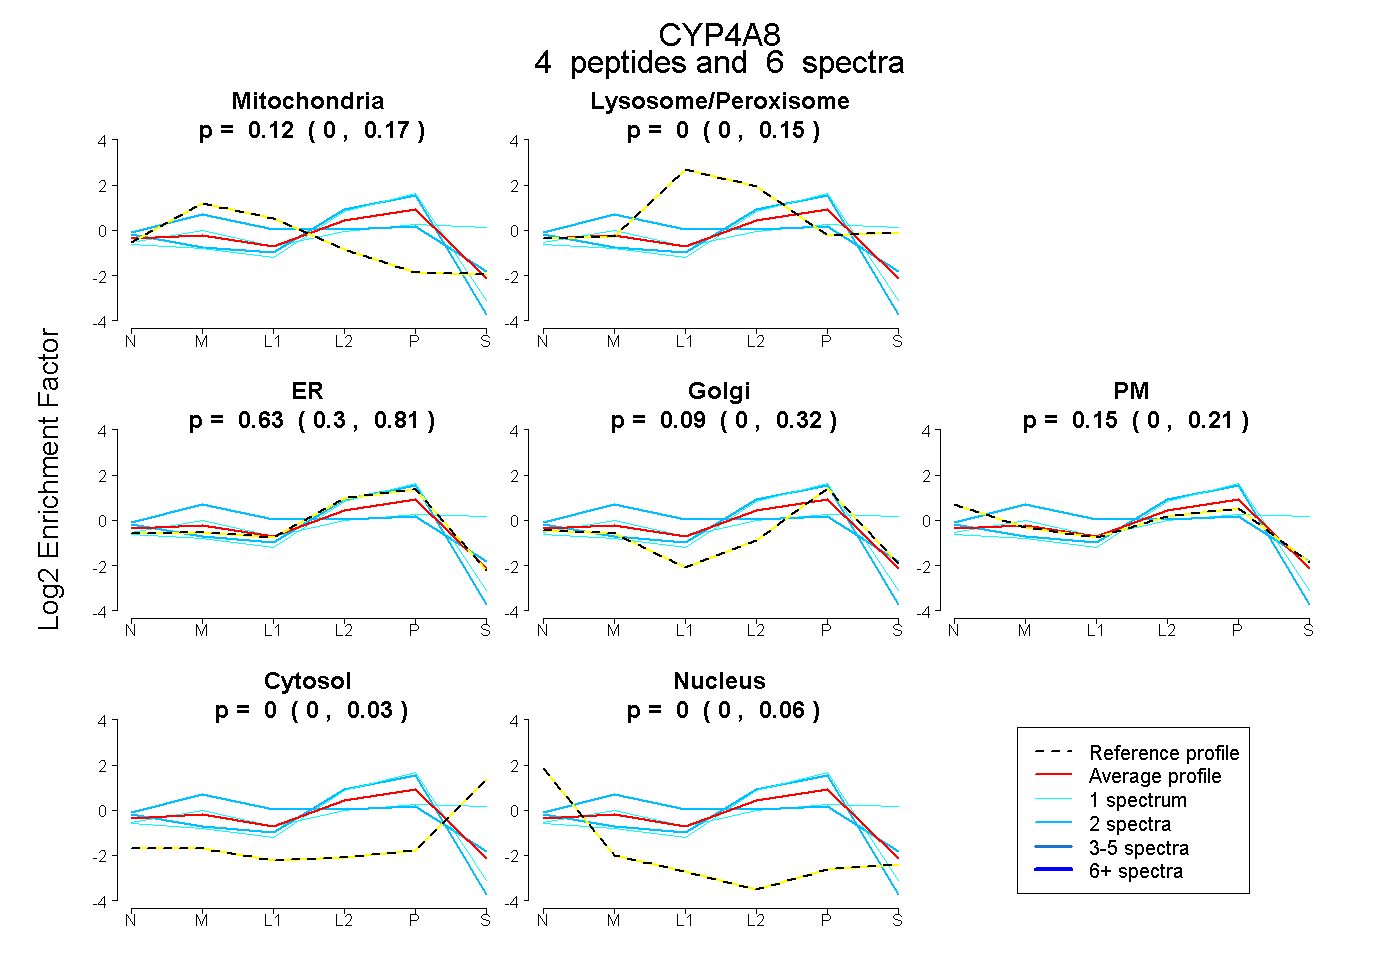 |
0.124 0.000 | 0.174 |
0.000 0.000 | 0.153 |
0.634 0.298 | 0.809 |
0.091 0.000 | 0.322 |
0.151 0.000 | 0.206 |
0.000 0.000 | 0.034 |
0.000 0.000 | 0.056 |
|||
| Plot | Lyso | Other | |||||||||||
| Expt C |
5 peptides |
17 spectra |
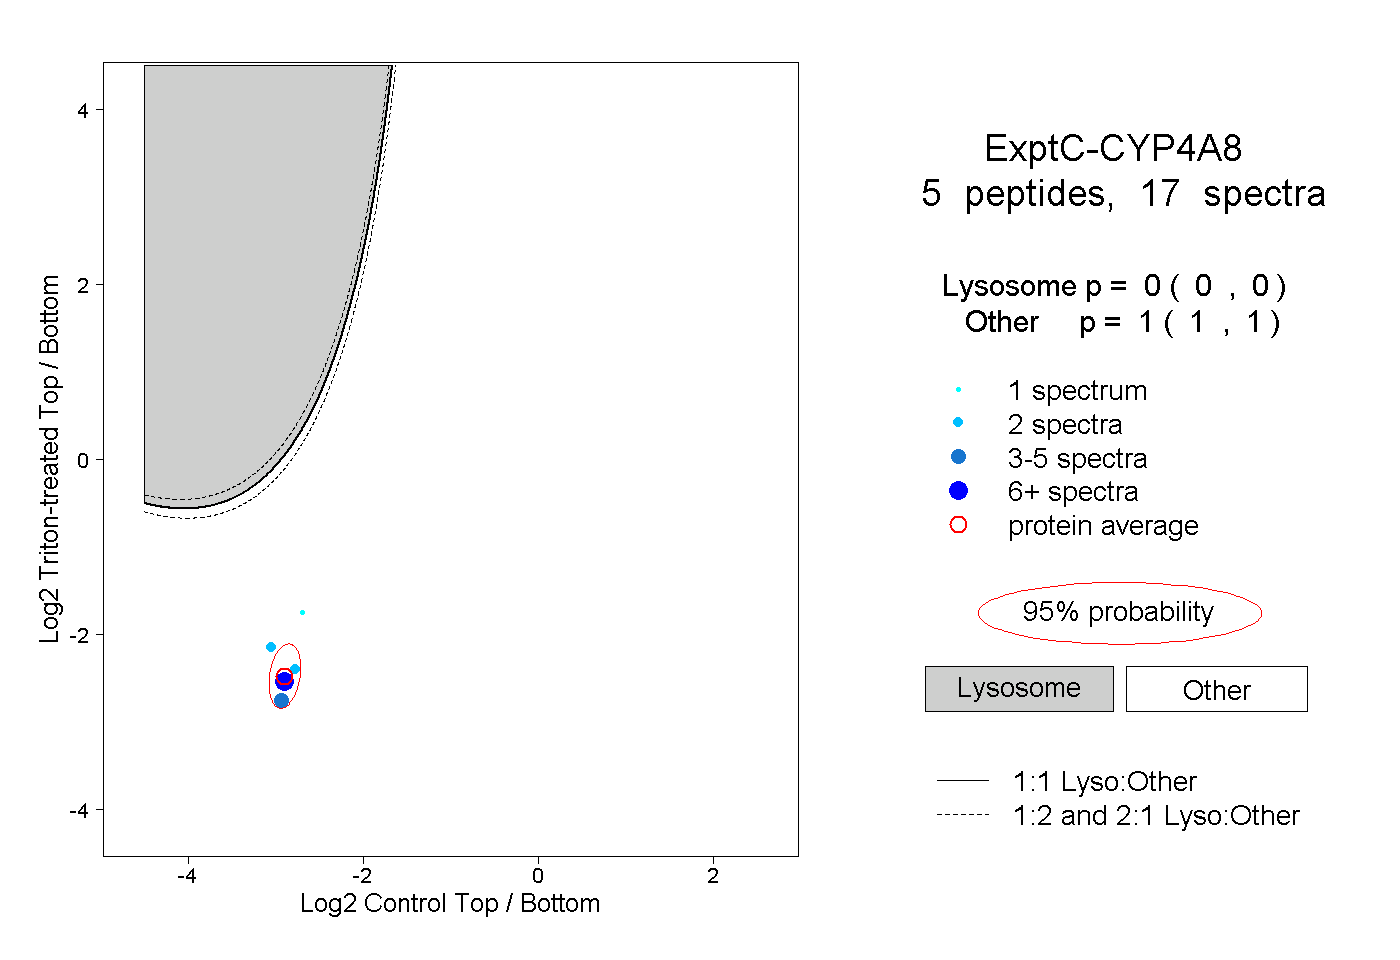 |
0.000 0.000 | 0.000 |
1.000 1.000 | 1.000 |
||||||||
| Plot | Lyso | Other | |||||||||||
| Expt D |
1 peptide |
1 spectrum |
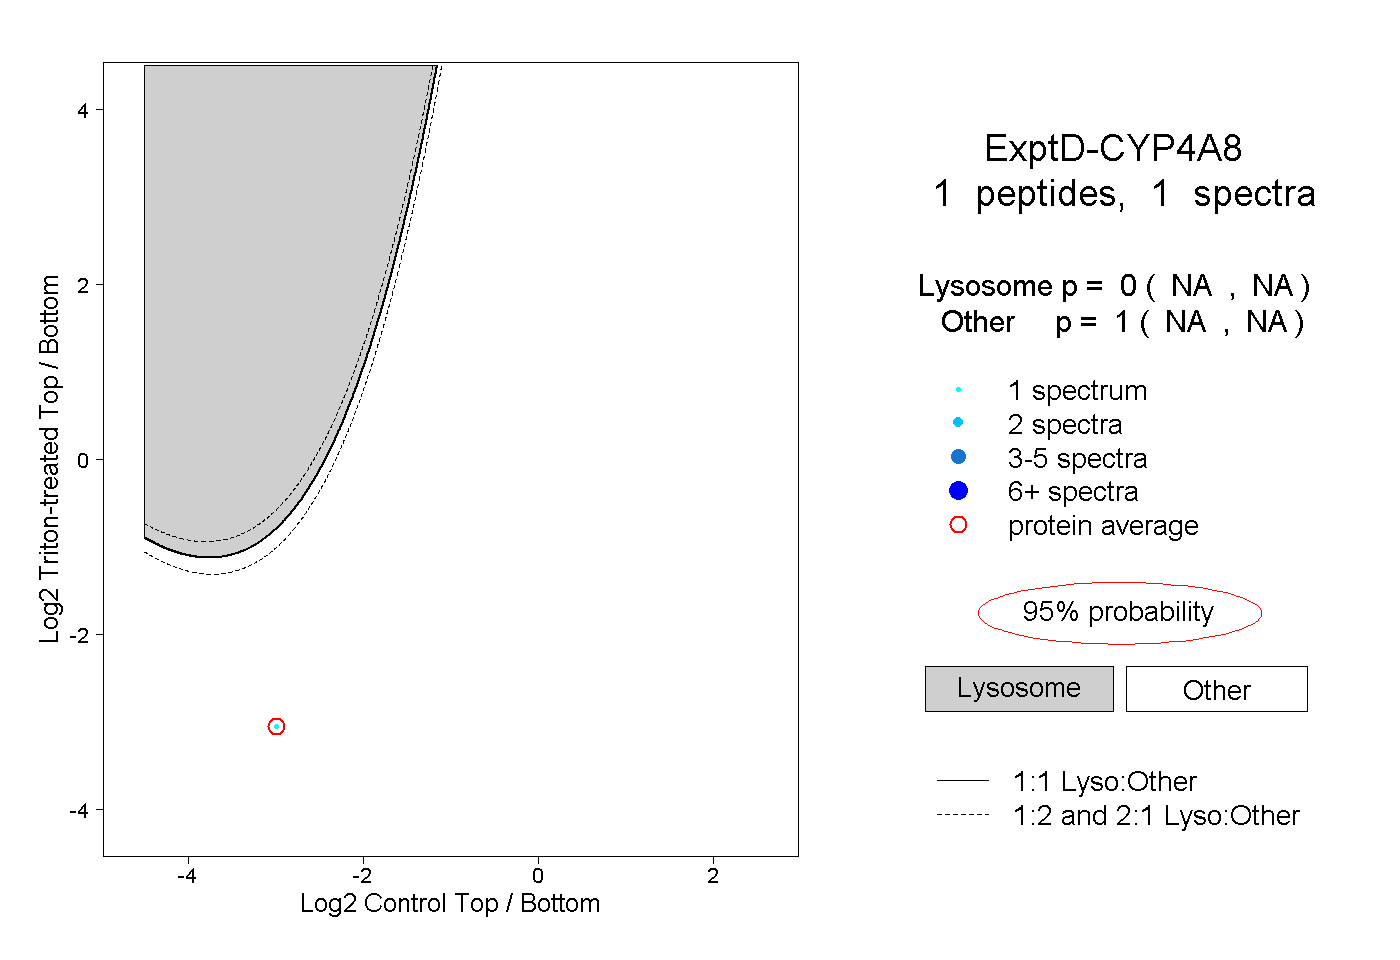 |
0.000 NA | NA |
1.000 NA | NA |