 5
5peptides
spectra
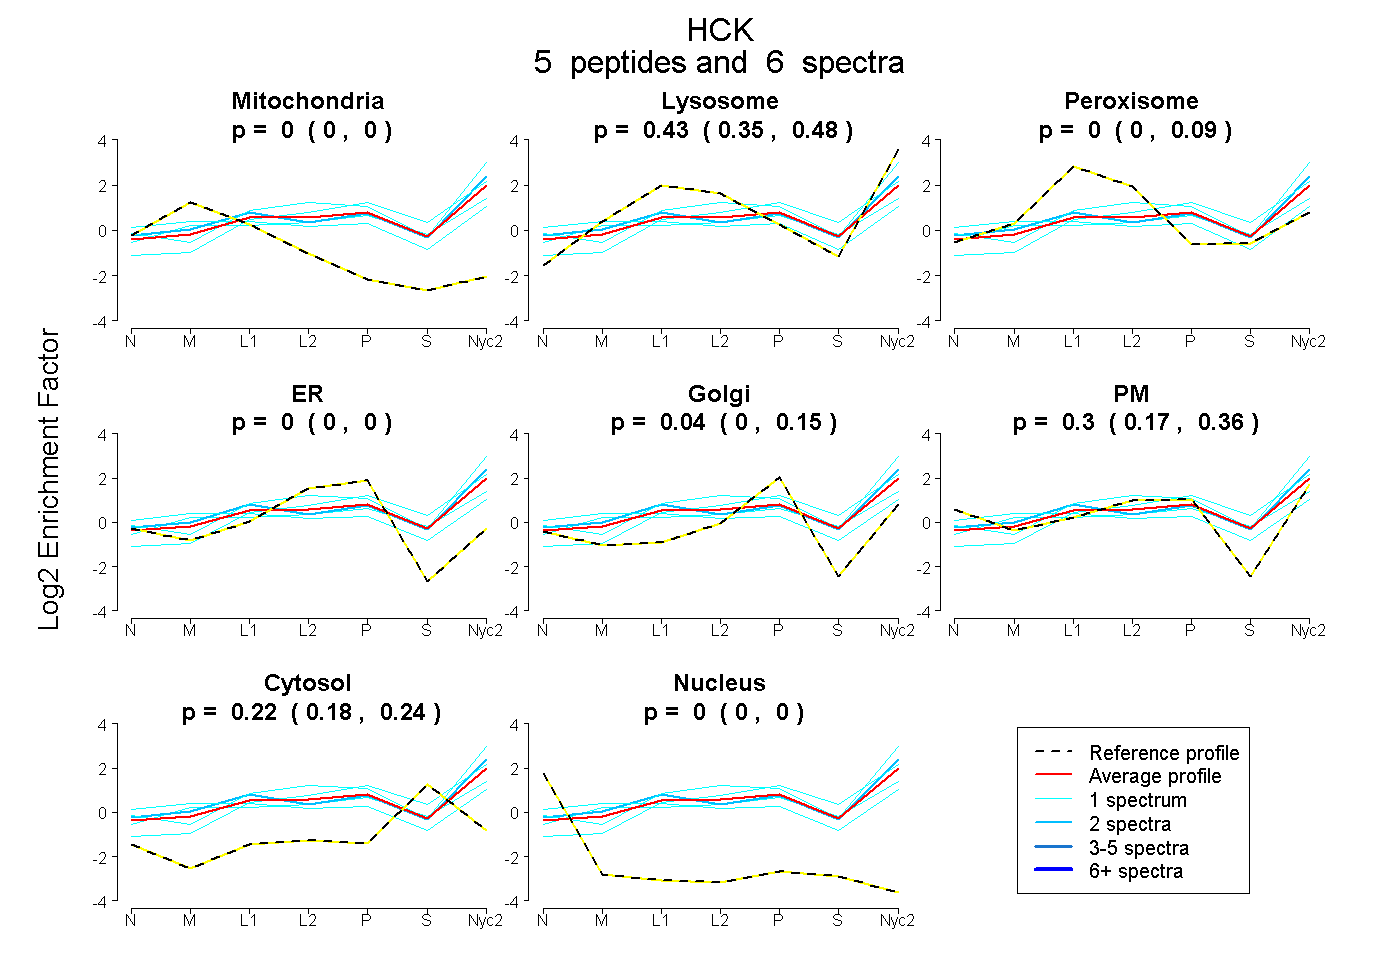
0.000 | 0.000
0.346 | 0.477
0.000 | 0.091
0.000 | 0.000
0.000 | 0.145
0.171 | 0.361
0.183 | 0.238
0.000 | 0.000
1peptide
spectrum
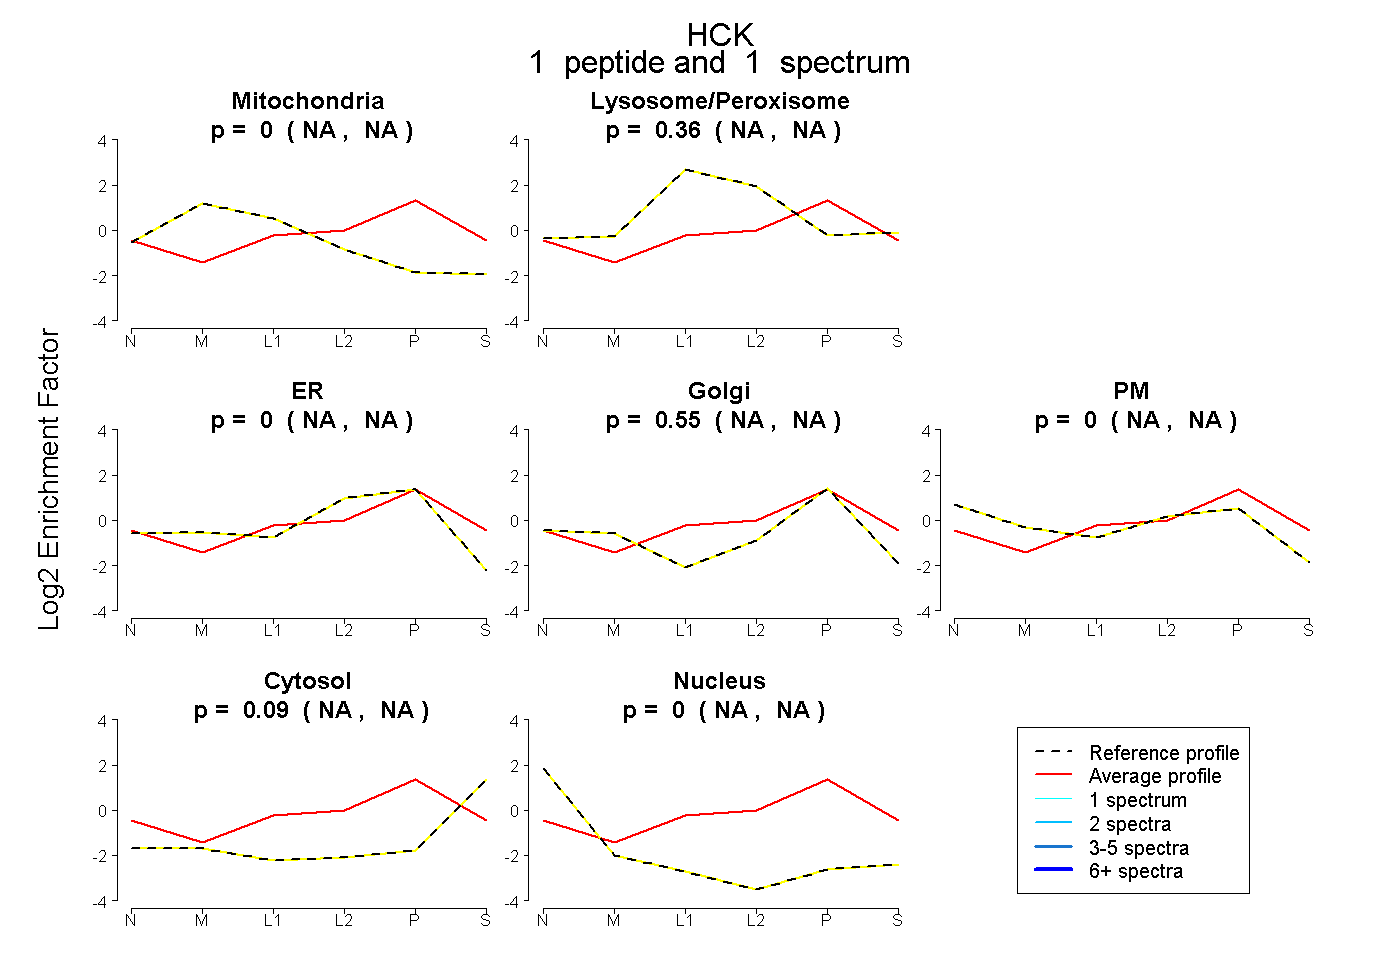
NA | NA
NA | NA
NA | NA
NA | NA
NA | NA
NA | NA
NA | NA
4peptides
spectra
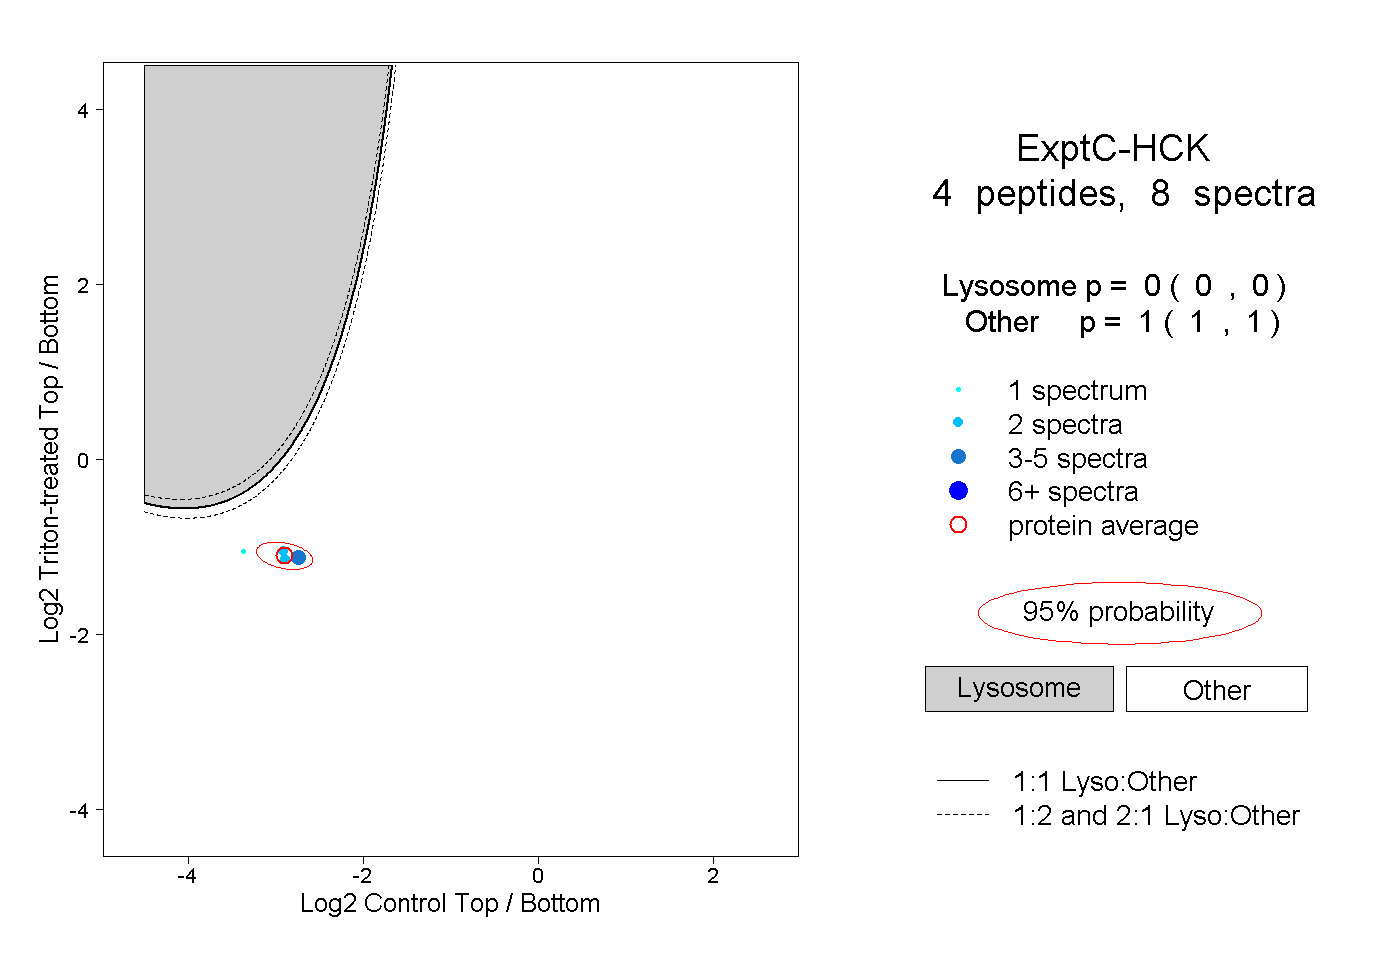
0.000 | 0.000
1.000 | 1.000
2peptides
spectra
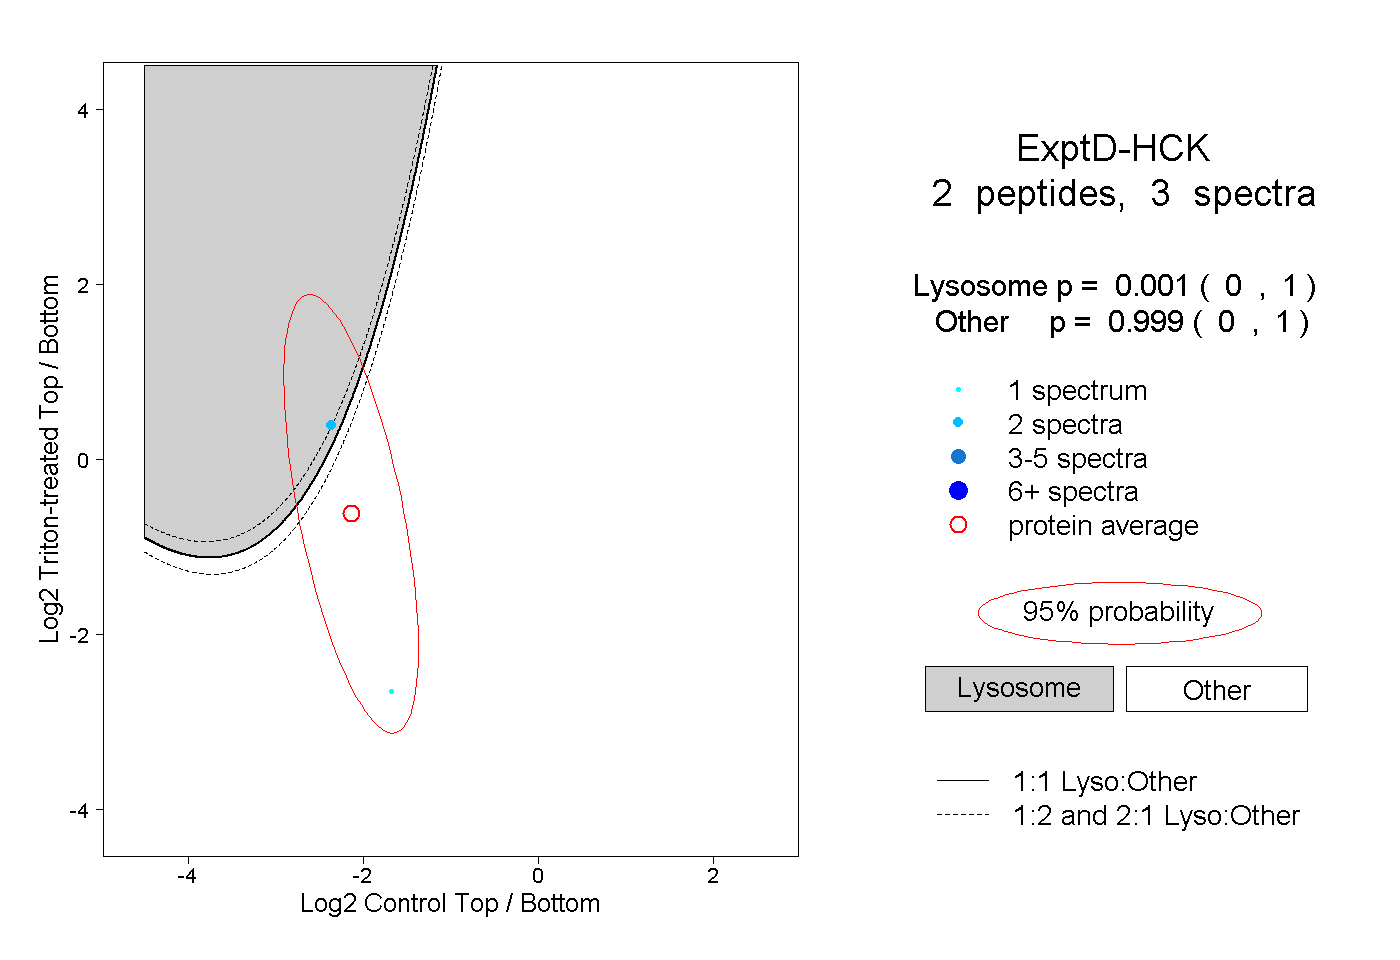
0.000 | 1.000
0.000 | 1.000