 5
5peptides
spectra
0.000 | 0.000
0.346 | 0.477
0.000 | 0.091
0.000 | 0.000
0.000 | 0.145
0.171 | 0.361
0.183 | 0.238
0.000 | 0.000
| Plot | Mito | Lyso | Perox | ER | Golgi | PM | Cytosol | Nucleus | |||||
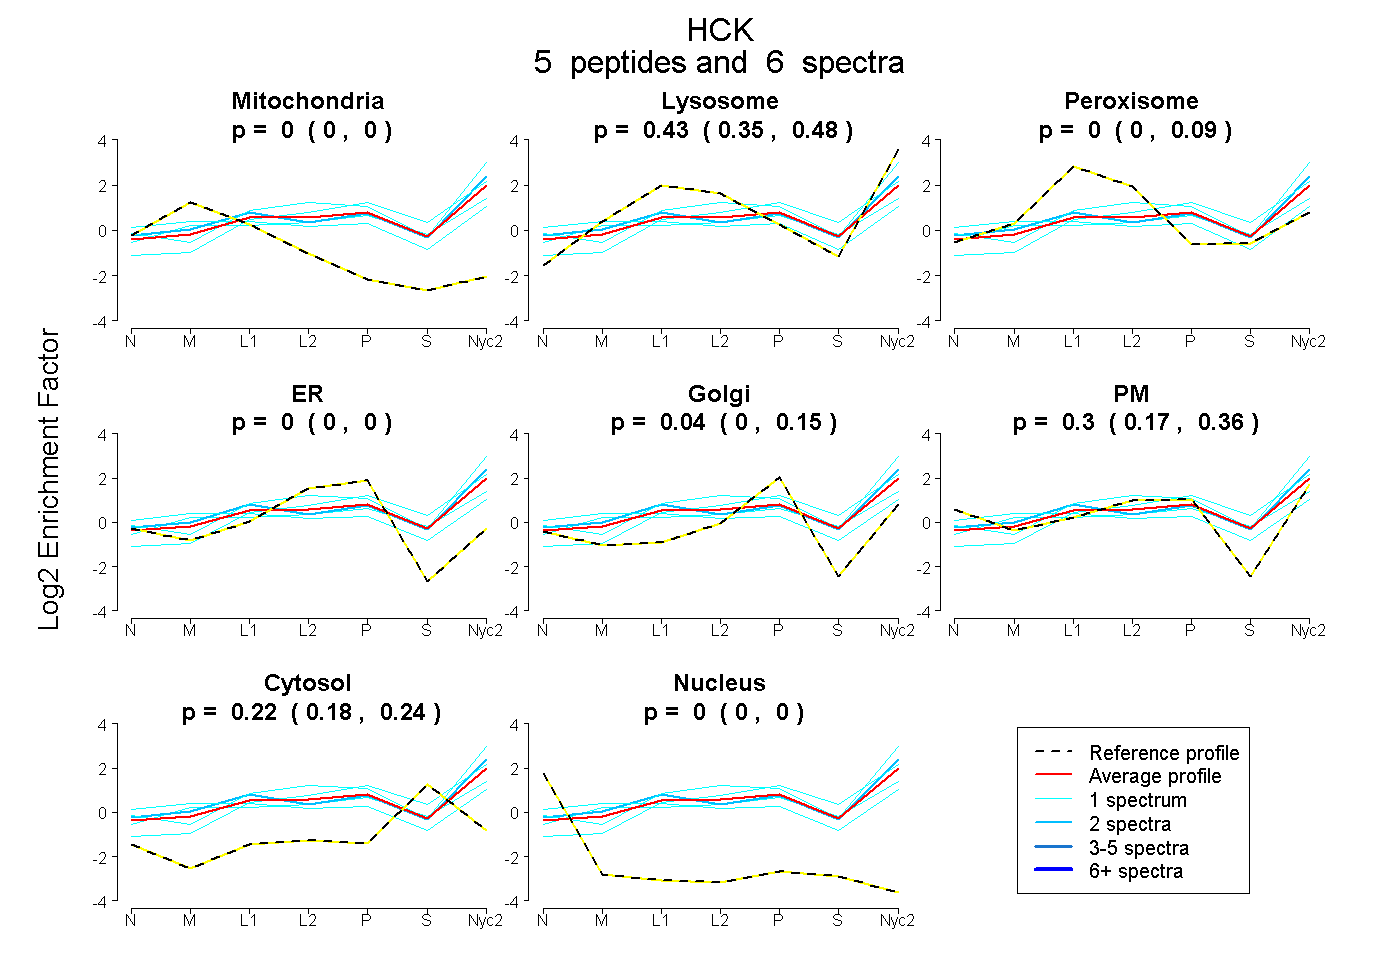
| Expt A |
5 peptides |
6 spectra |
|
0.000 0.000 | 0.000 |
0.432 0.346 | 0.477 |
0.004 0.000 | 0.091 |
0.000 0.000 | 0.000 |
0.042 0.000 | 0.145 |
0.303 0.171 | 0.361 |
0.220 0.183 | 0.238 |
0.000 0.000 | 0.000 |
| 1 spectrum, HLLAPGNMLGSFMIR | 0.142 | 0.160 | 0.099 | 0.000 | 0.000 | 0.440 | 0.159 | 0.000 | ||
| 1 spectrum, DFDPQHGDTVK | 0.005 | 0.318 | 0.117 | 0.000 | 0.197 | 0.131 | 0.233 | 0.000 | ||
| 1 spectrum, TLDSGGFYISPR | 0.000 | 0.551 | 0.000 | 0.000 | 0.000 | 0.336 | 0.113 | 0.000 | ||
| 1 spectrum, GDQMVVLEESGEWWK | 0.000 | 0.542 | 0.000 | 0.000 | 0.194 | 0.000 | 0.264 | 0.000 | ||
| 2 spectra, EGYIPSNYVAR | 0.000 | 0.481 | 0.000 | 0.000 | 0.000 | 0.332 | 0.187 | 0.000 |
| Plot | Mito | Lyso or Perox | ER | Golgi | PM | Cytosol | Nucleus | ||||||
| Expt B |
1 peptide |
1 spectrum |
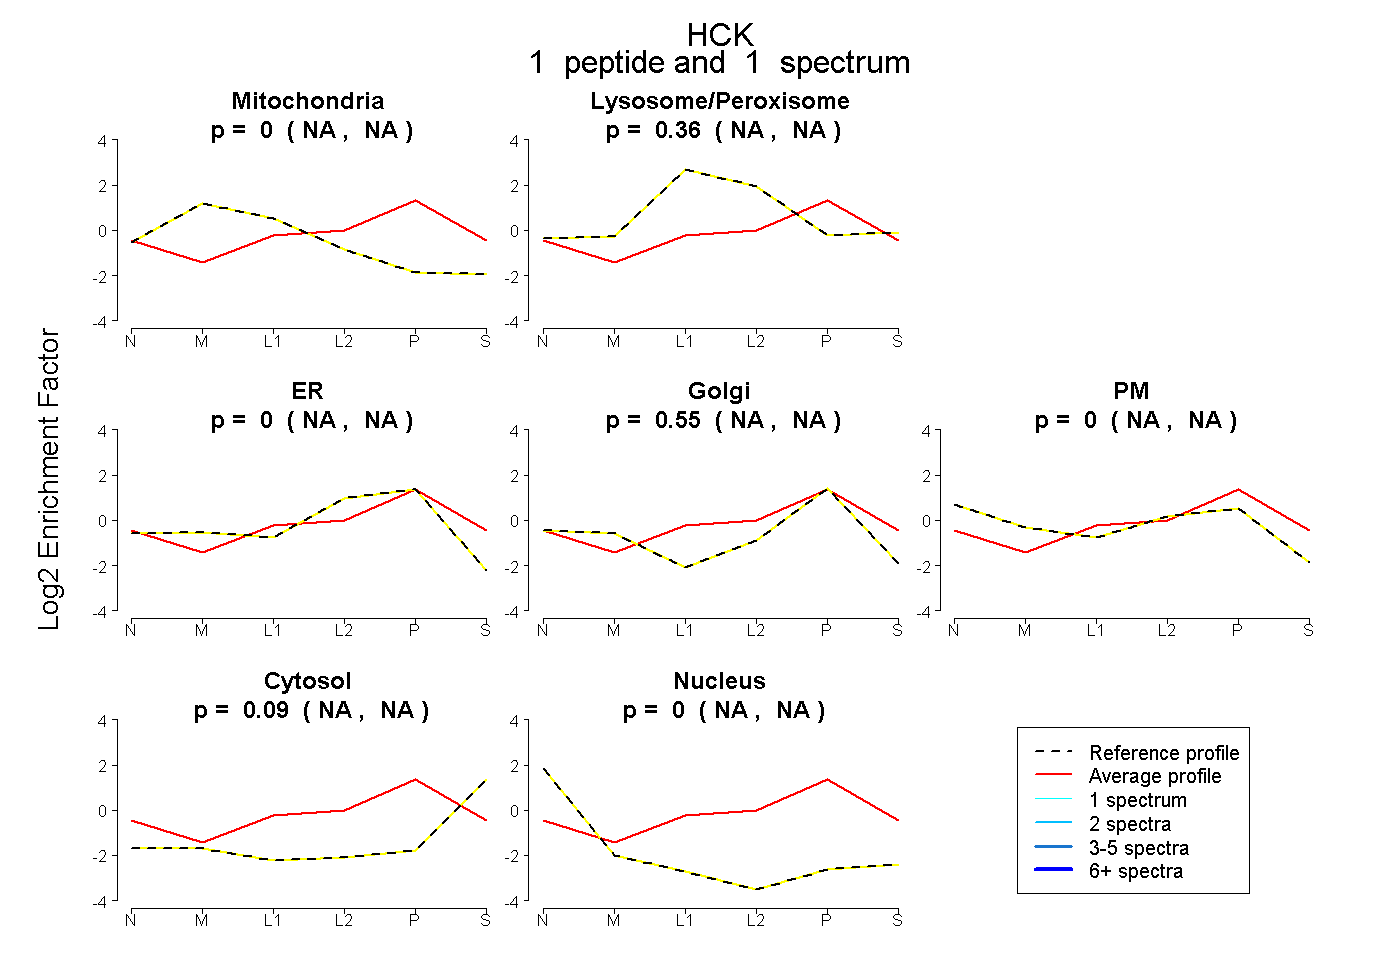 |
0.000 NA | NA |
0.359 NA | NA |
0.000 NA | NA |
0.553 NA | NA |
0.000 NA | NA |
0.087 NA | NA |
0.000 NA | NA |
|||
| Plot | Lyso | Other | |||||||||||
| Expt C |
4 peptides |
8 spectra |
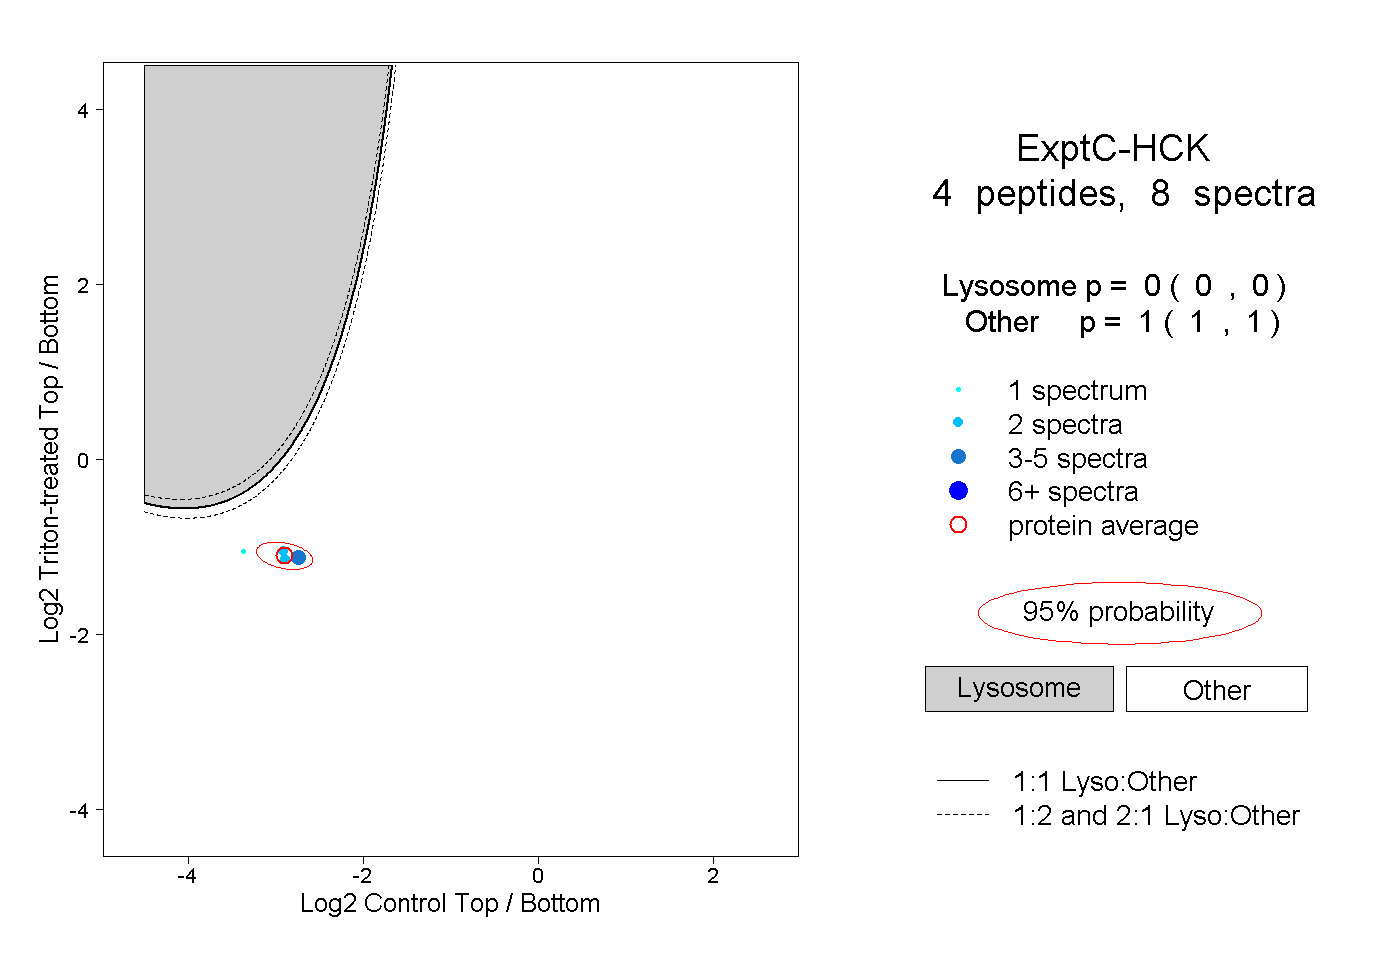 |
0.000 0.000 | 0.000 |
1.000 1.000 | 1.000 |
||||||||
| Plot | Lyso | Other | |||||||||||
| Expt D |
2 peptides |
3 spectra |
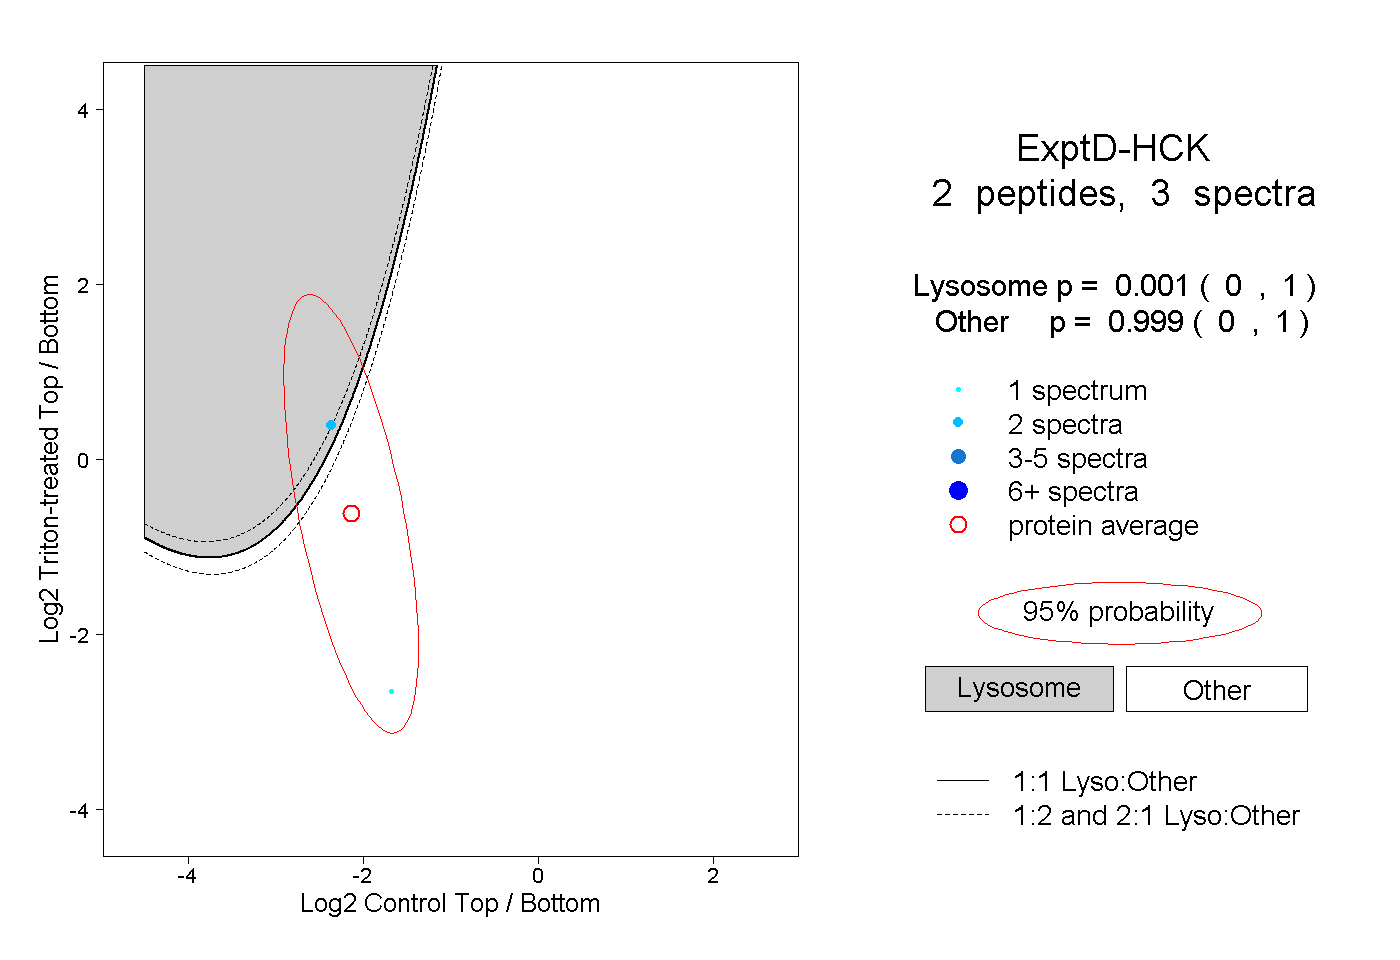 |
0.001 0.000 | 1.000 |
0.999 0.000 | 1.000 |