 20
20peptides
spectra
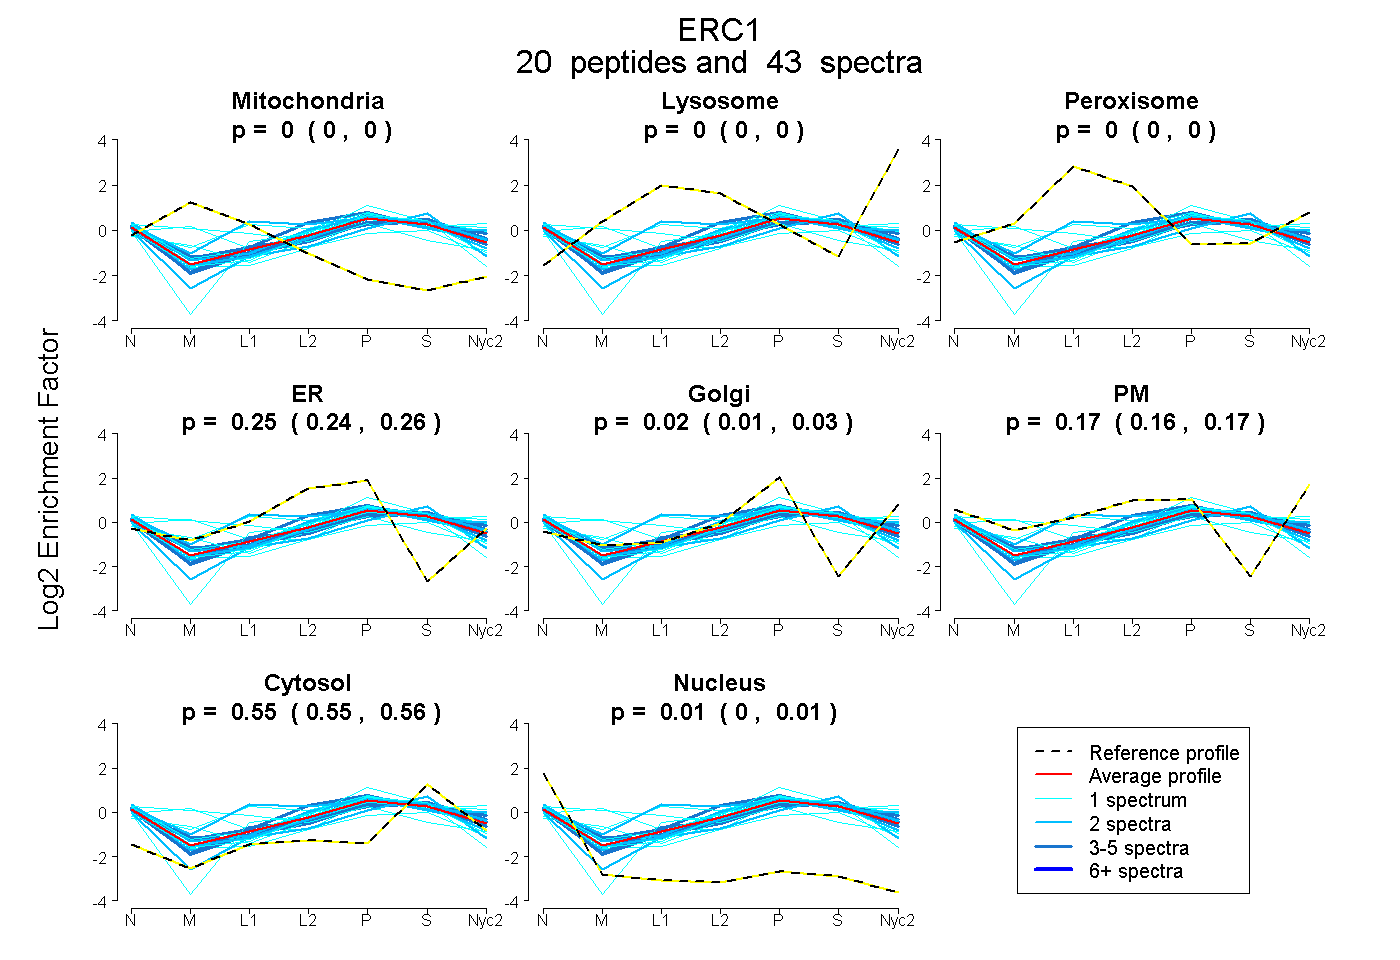
0.000 | 0.000
0.000 | 0.000
0.000 | 0.000
0.241 | 0.263
0.008 | 0.033
0.156 | 0.175
0.549 | 0.555
0.003 | 0.008
12peptides
spectra
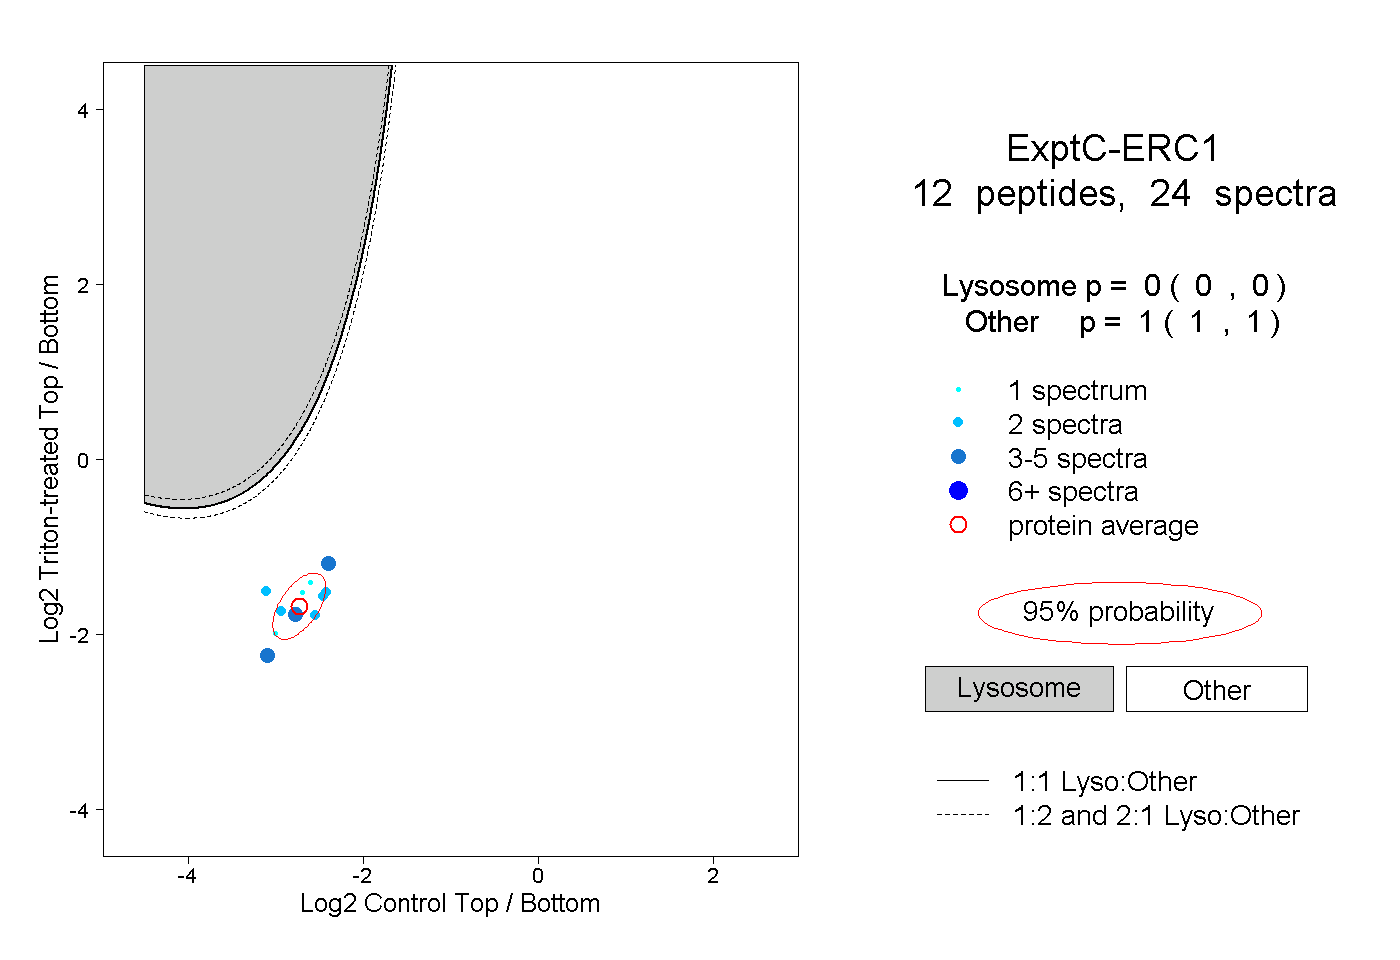
0.000 | 0.000
1.000 | 1.000
1peptide
spectrum
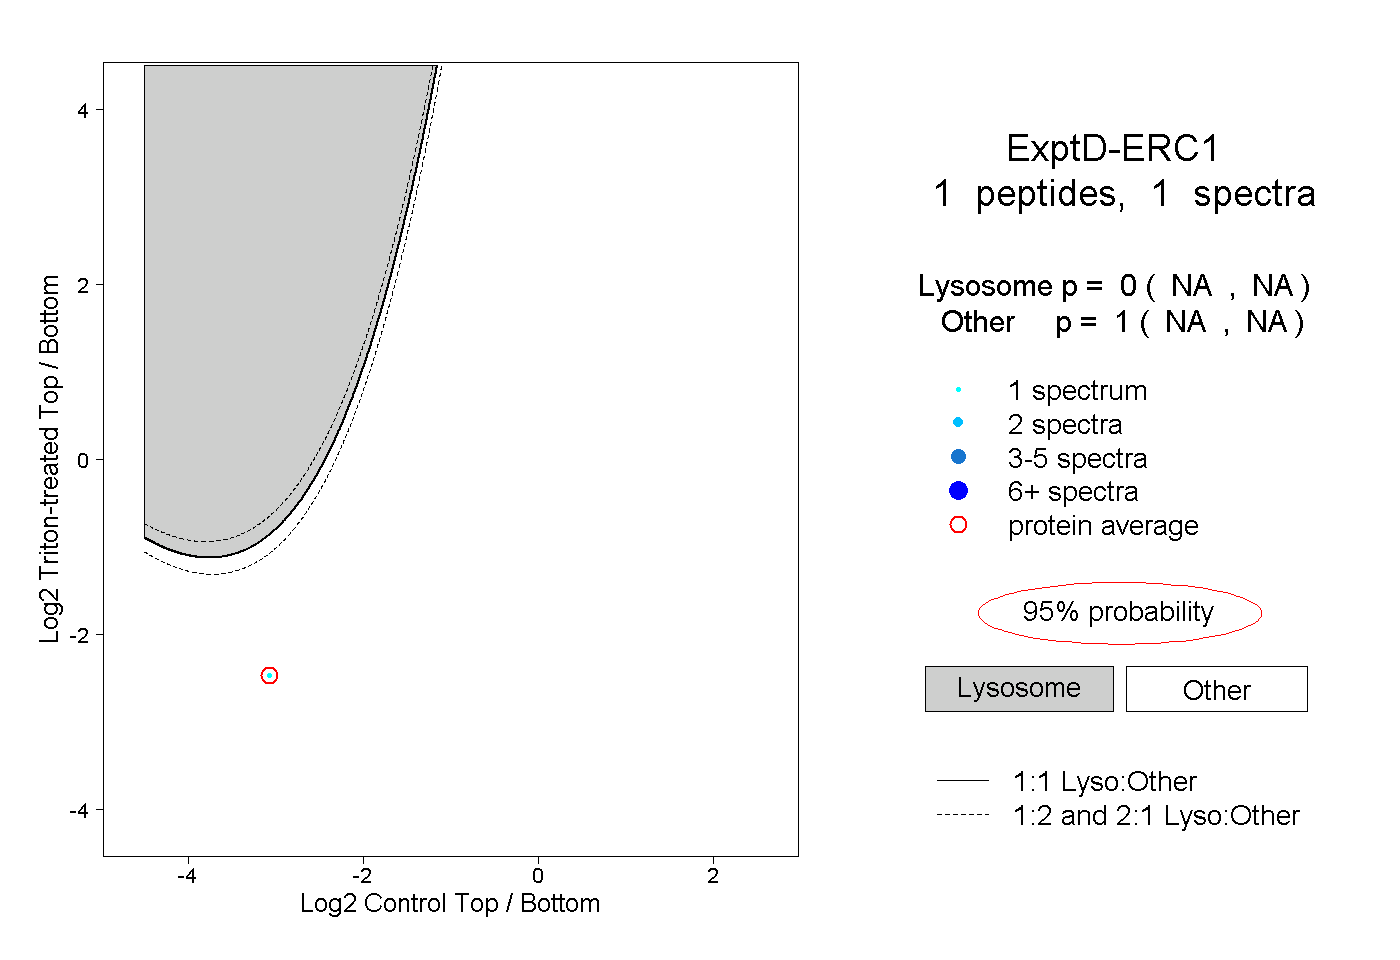
NA | NA
NA | NA