 20
20peptides
spectra
0.000 | 0.000
0.000 | 0.000
0.000 | 0.000
0.241 | 0.263
0.008 | 0.033
0.156 | 0.175
0.549 | 0.555
0.003 | 0.008
12peptides
spectra
0.000 | 0.000
1.000 | 1.000
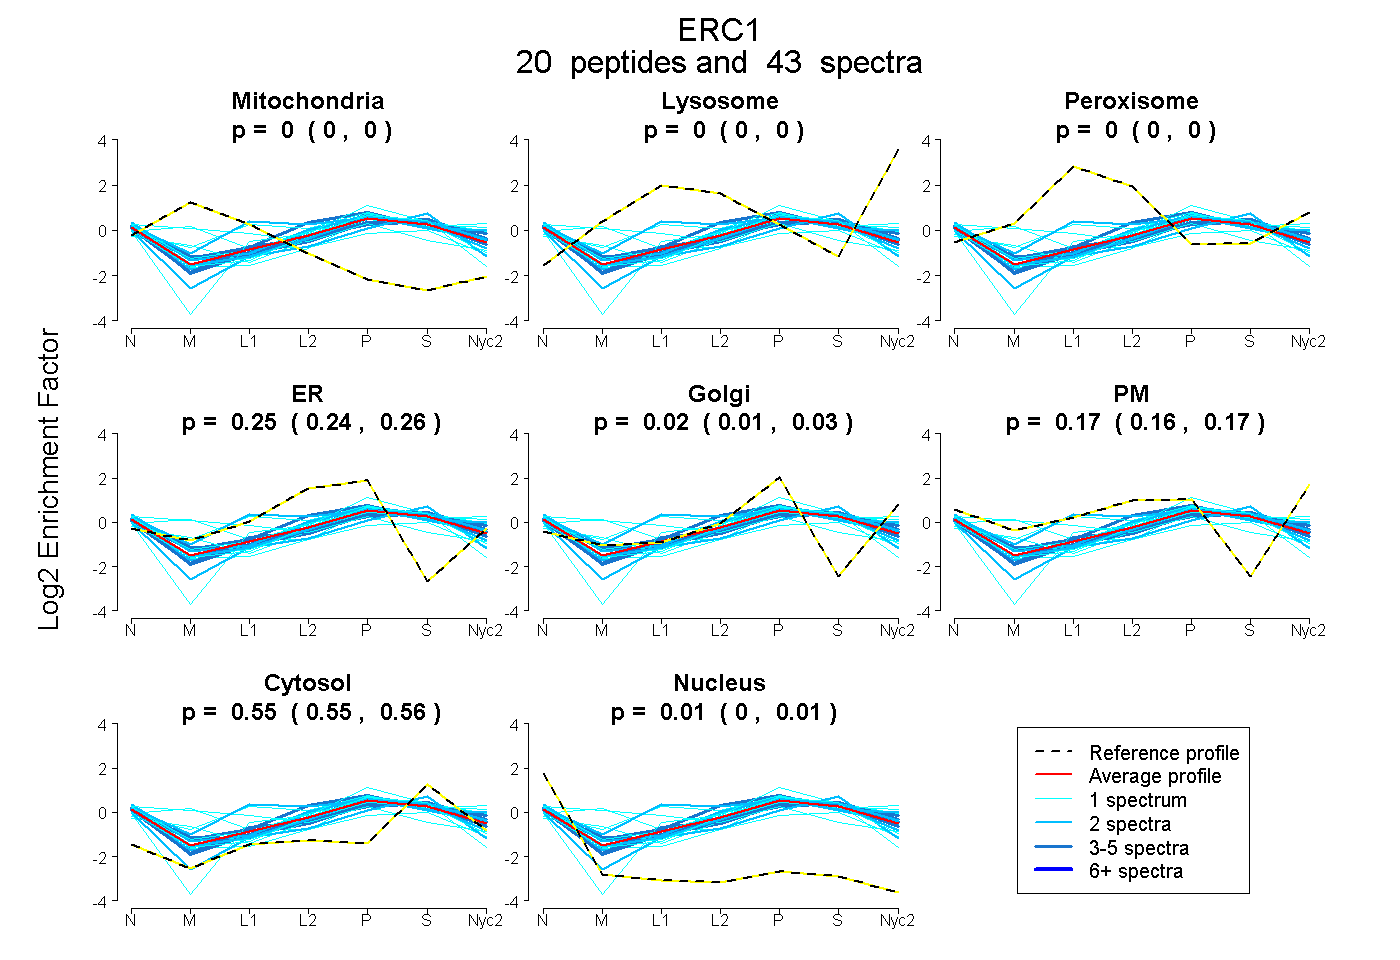
| Plot | Mito | Lyso | Perox | ER | Golgi | PM | Cytosol | Nucleus | |||||
| Expt A |
20 peptides |
43 spectra |
|
0.000 0.000 | 0.000 |
0.000 0.000 | 0.000 |
0.000 0.000 | 0.000 |
0.254 0.241 | 0.263 |
0.022 0.008 | 0.033 |
0.166 0.156 | 0.175 |
0.552 0.549 | 0.555 |
0.006 0.003 | 0.008 |
||
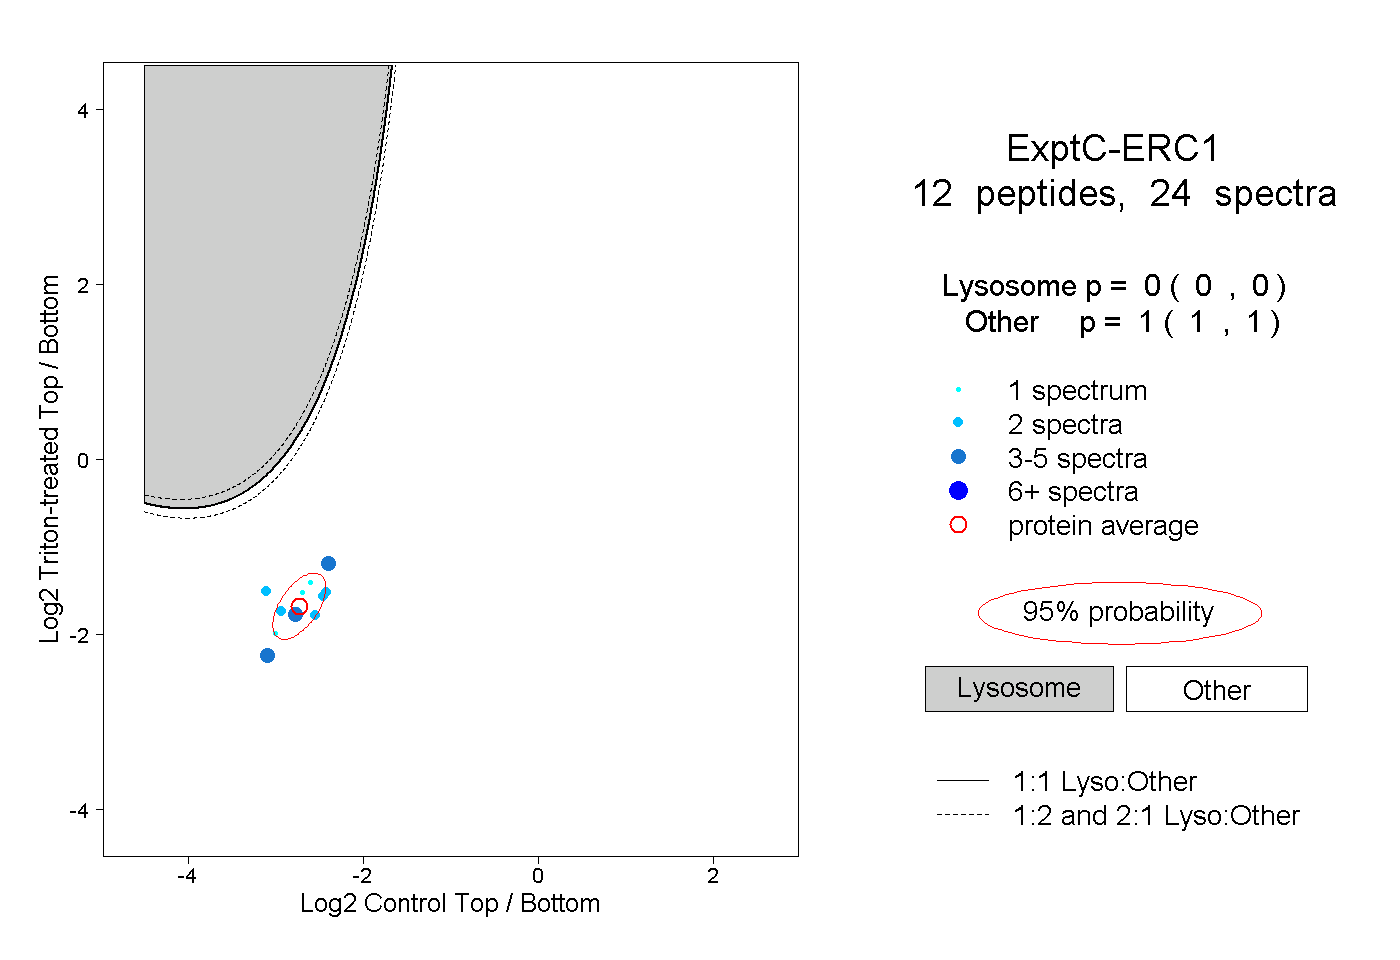
| Plot | Lyso | Other | |||||||||||
| Expt C |
12 peptides |
24 spectra |
|
0.000 0.000 | 0.000 |
1.000 1.000 | 1.000 |
| 1 spectrum, LSSSMNSIK | 0.000 | 1.000 | ||||||||
| 2 spectra, ELFLLR | 0.000 | 1.000 | ||||||||
| 1 spectrum, ESLTAK | 0.000 | 1.000 | ||||||||
| 1 spectrum, LETLTNQFSDSK | 0.000 | 1.000 | ||||||||
| 2 spectra, EVENEK | 0.000 | 1.000 | ||||||||
| 3 spectra, LMADNYEDDHFR | 0.000 | 1.000 | ||||||||
| 2 spectra, AQTEVDR | 0.000 | 1.000 | ||||||||
| 3 spectra, SAQMLEEAR | 0.000 | 1.000 | ||||||||
| 2 spectra, ENDLLR | 0.000 | 1.000 | ||||||||
| 3 spectra, VEPSSQSPGR | 0.000 | 1.000 | ||||||||
| 2 spectra, LSSTQQSLAEK | 0.000 | 1.000 | ||||||||
| 2 spectra, LPYGVR | 0.000 | 1.000 |
| Plot | Lyso | Other | |||||||||||
| Expt D |
1 peptide |
1 spectrum |
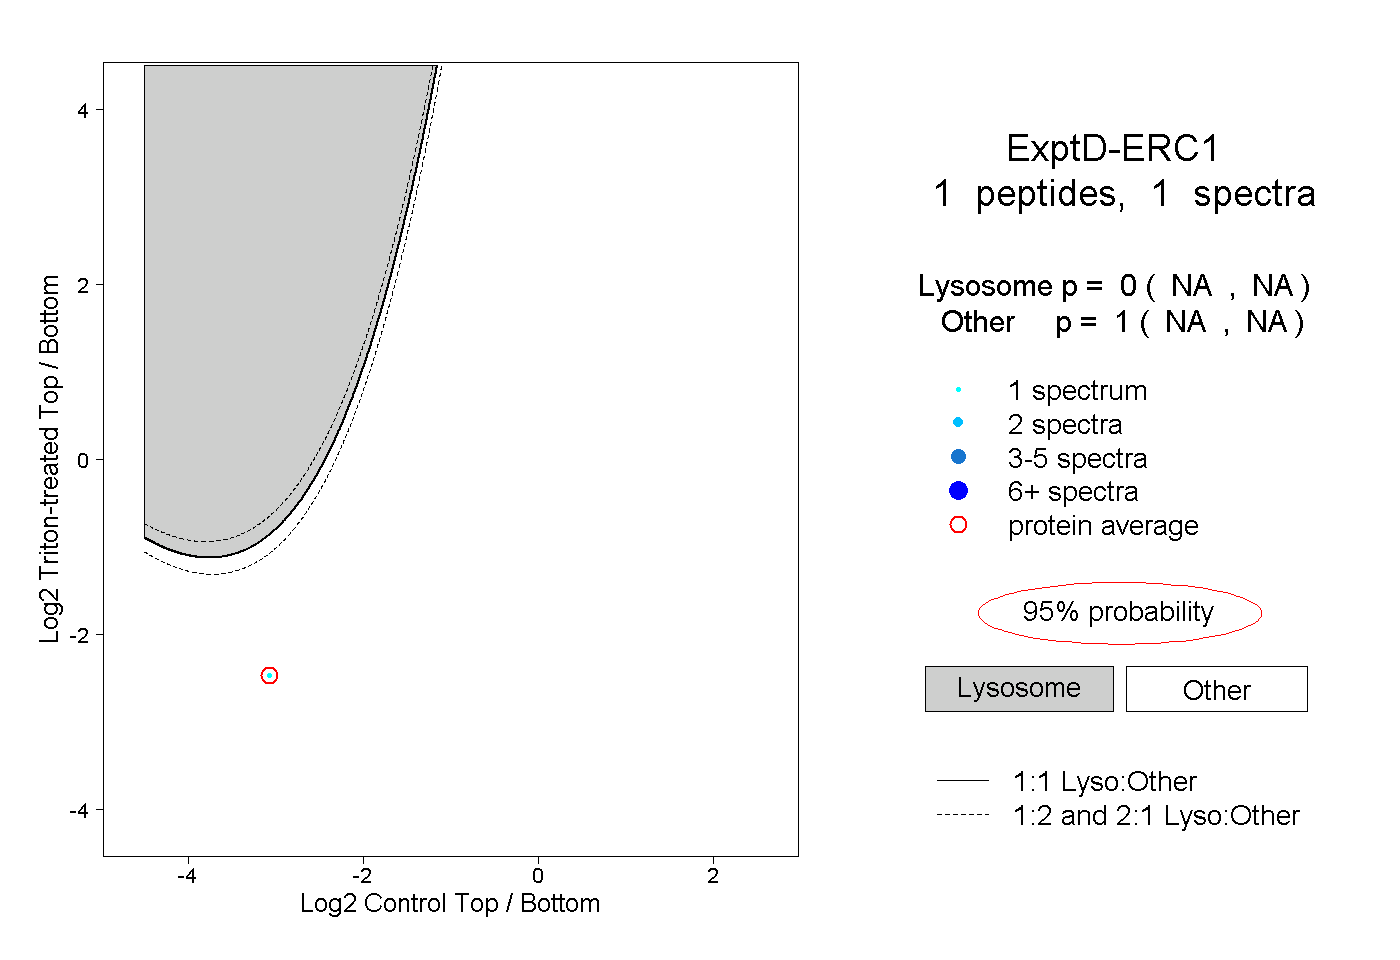 |
0.000 NA | NA |
1.000 NA | NA |