 4
4peptides
spectra
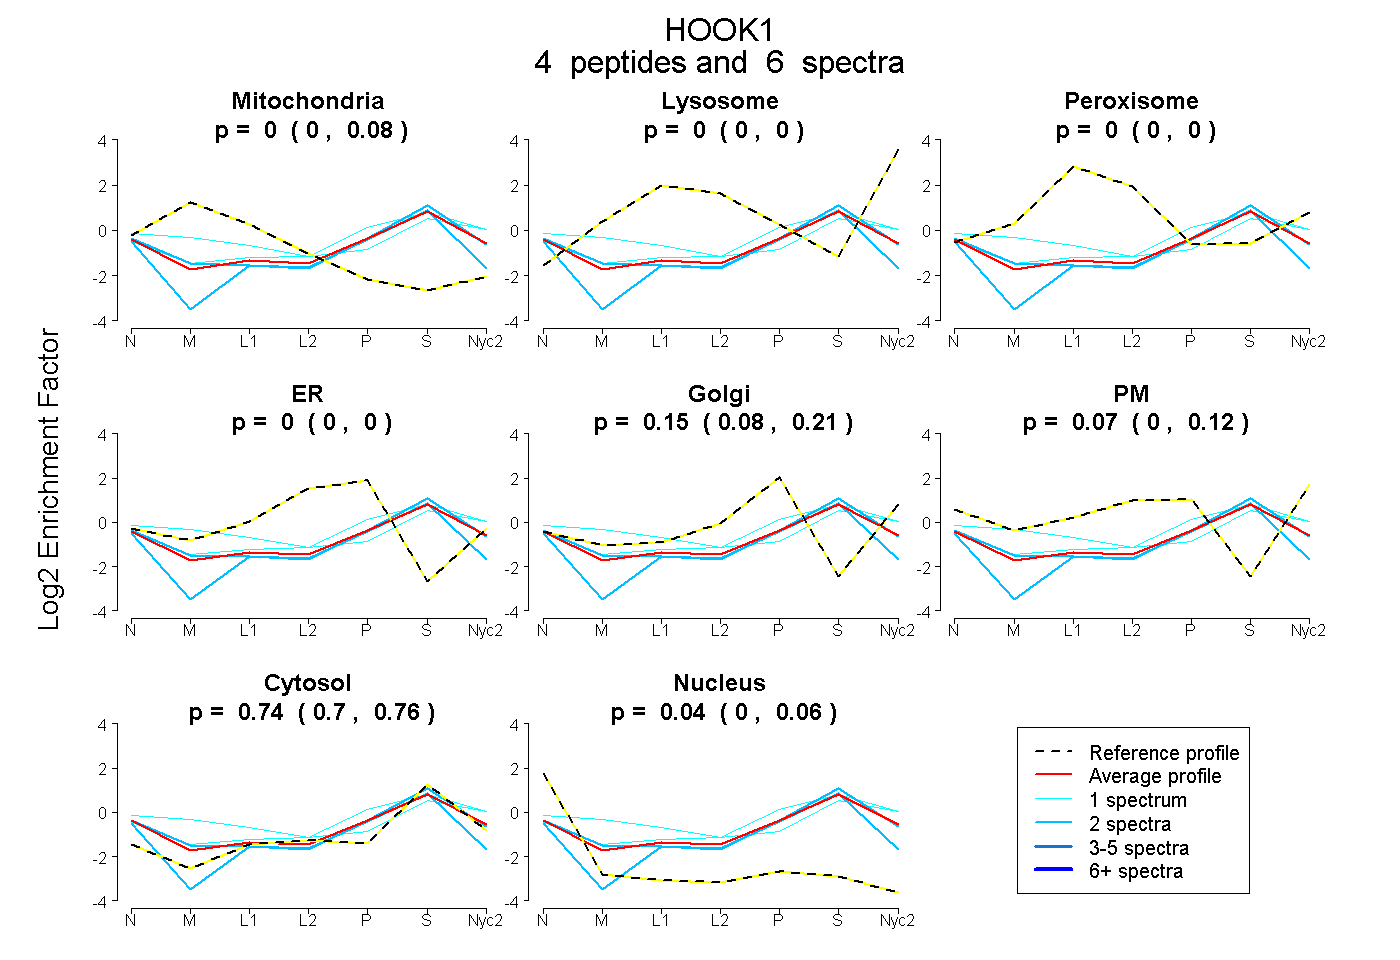
0.000 | 0.079
0.000 | 0.000
0.000 | 0.000
0.000 | 0.000
0.085 | 0.214
0.000 | 0.119
0.696 | 0.761
0.000 | 0.062
1peptide
spectrum
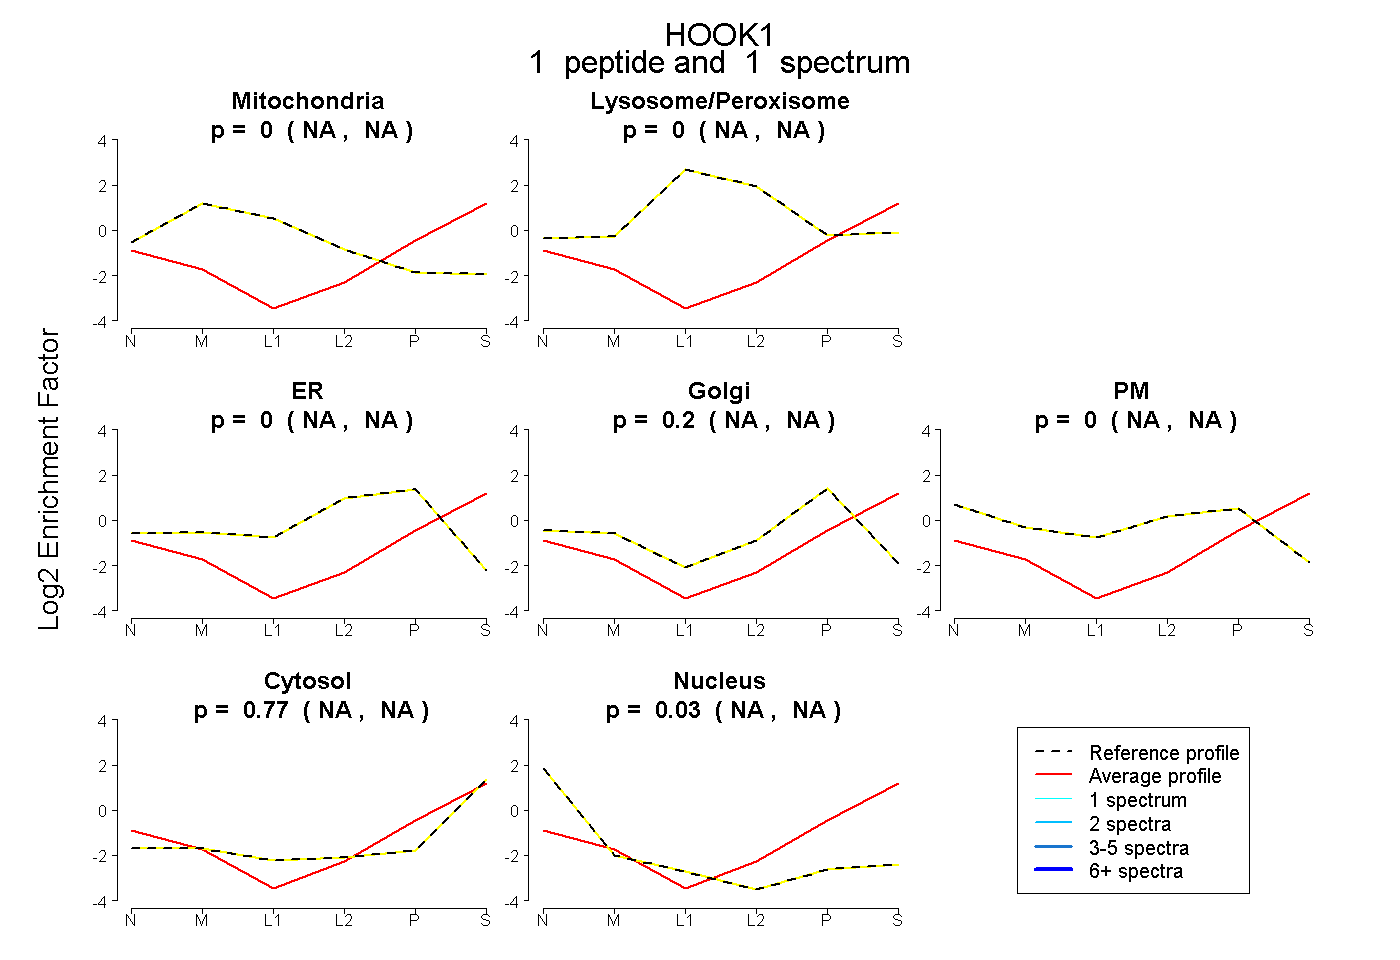
NA | NA
NA | NA
NA | NA
NA | NA
NA | NA
NA | NA
NA | NA
3peptides
spectra
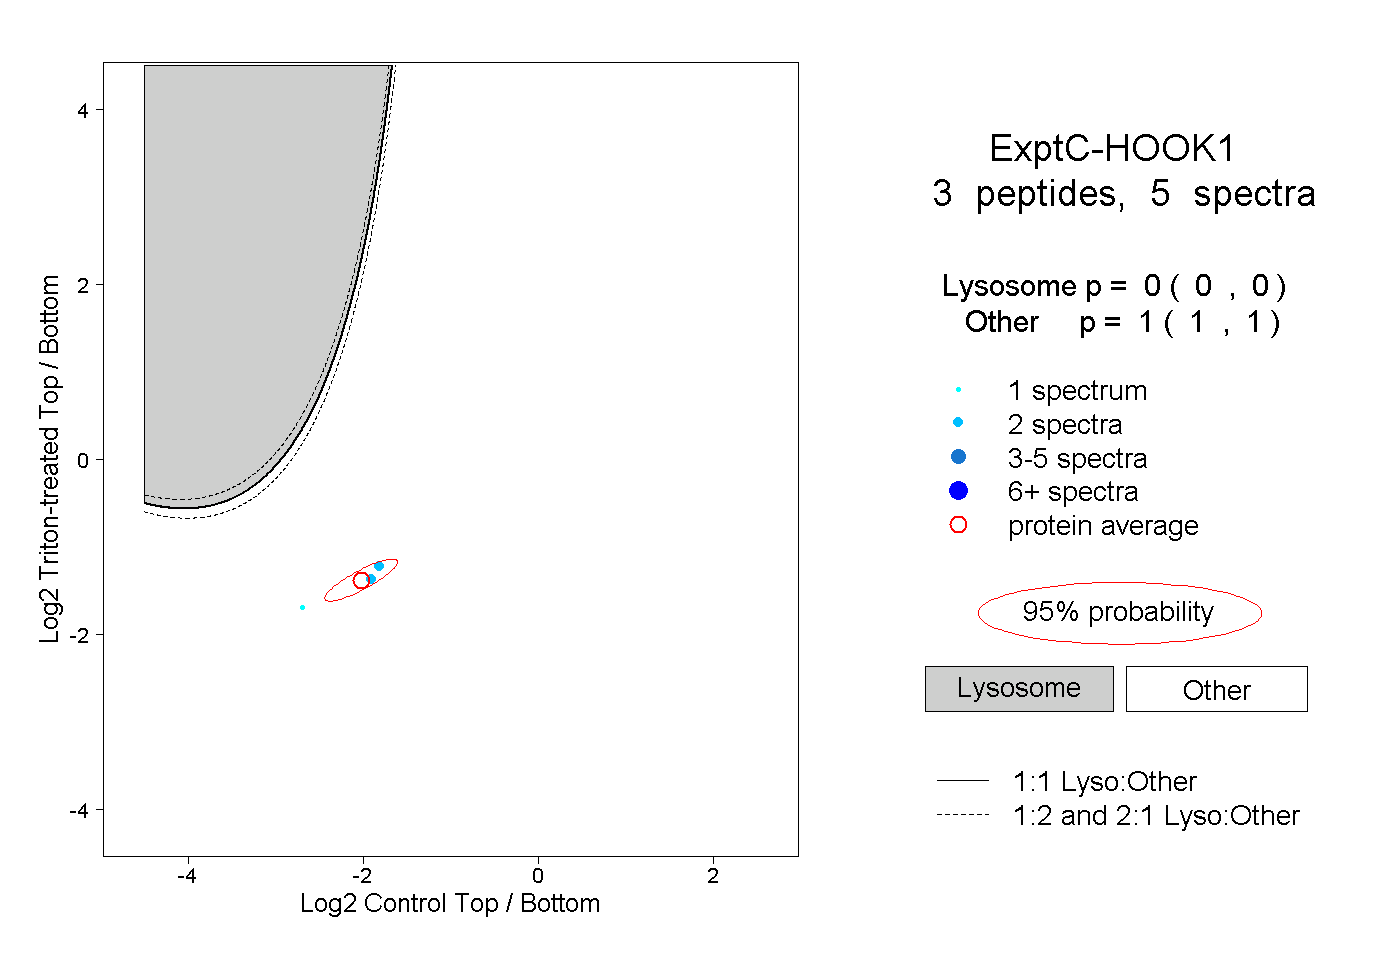
0.000 | 0.000
1.000 | 1.000