 4
4peptides
spectra
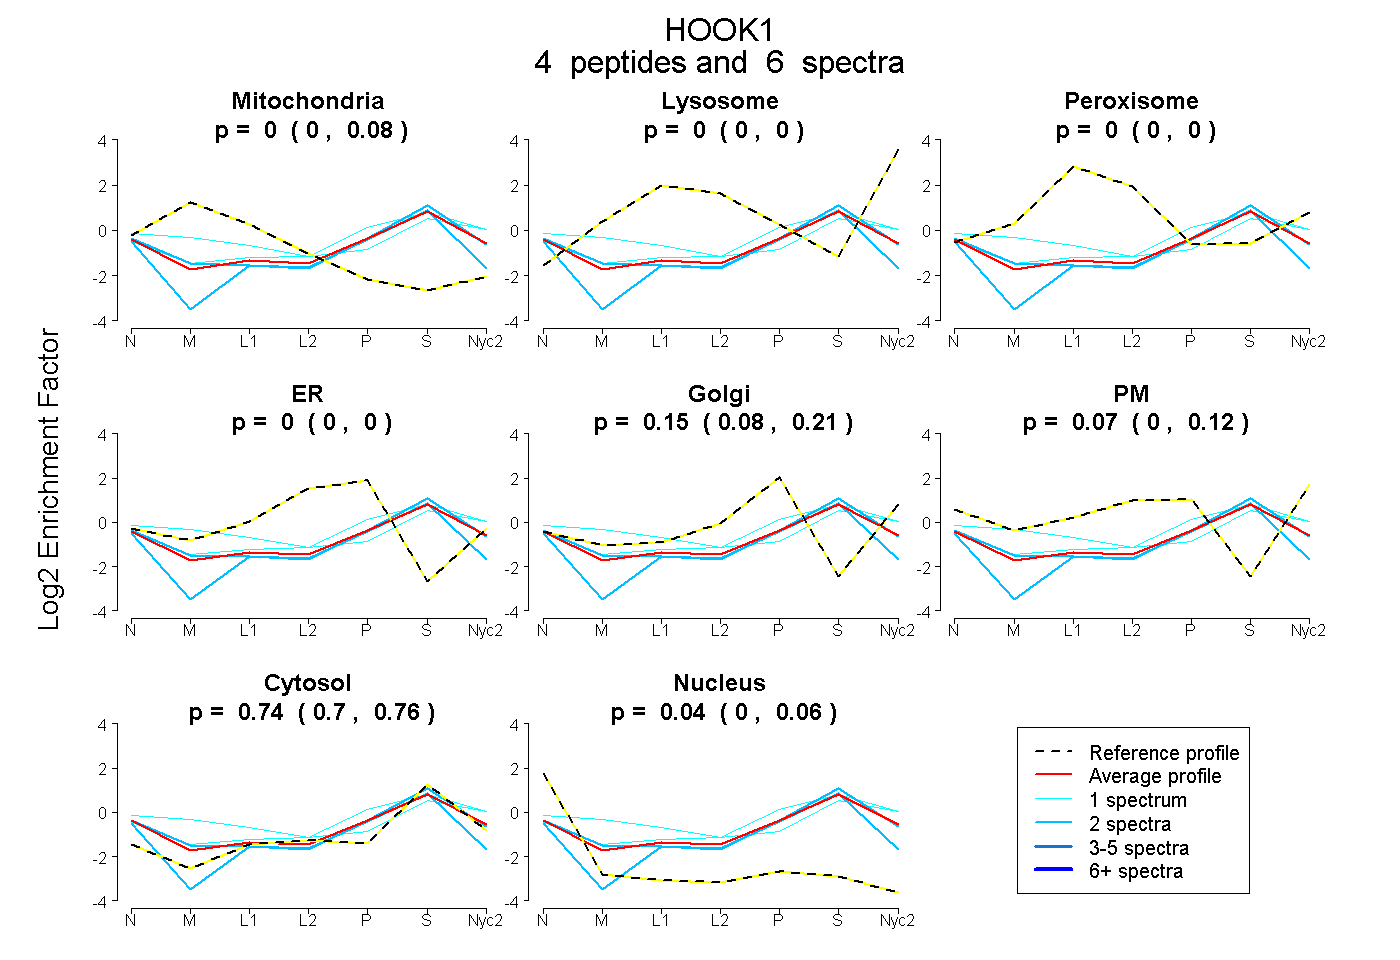
0.000 | 0.079
0.000 | 0.000
0.000 | 0.000
0.000 | 0.000
0.085 | 0.214
0.000 | 0.119
0.696 | 0.761
0.000 | 0.062
1peptide
spectrum
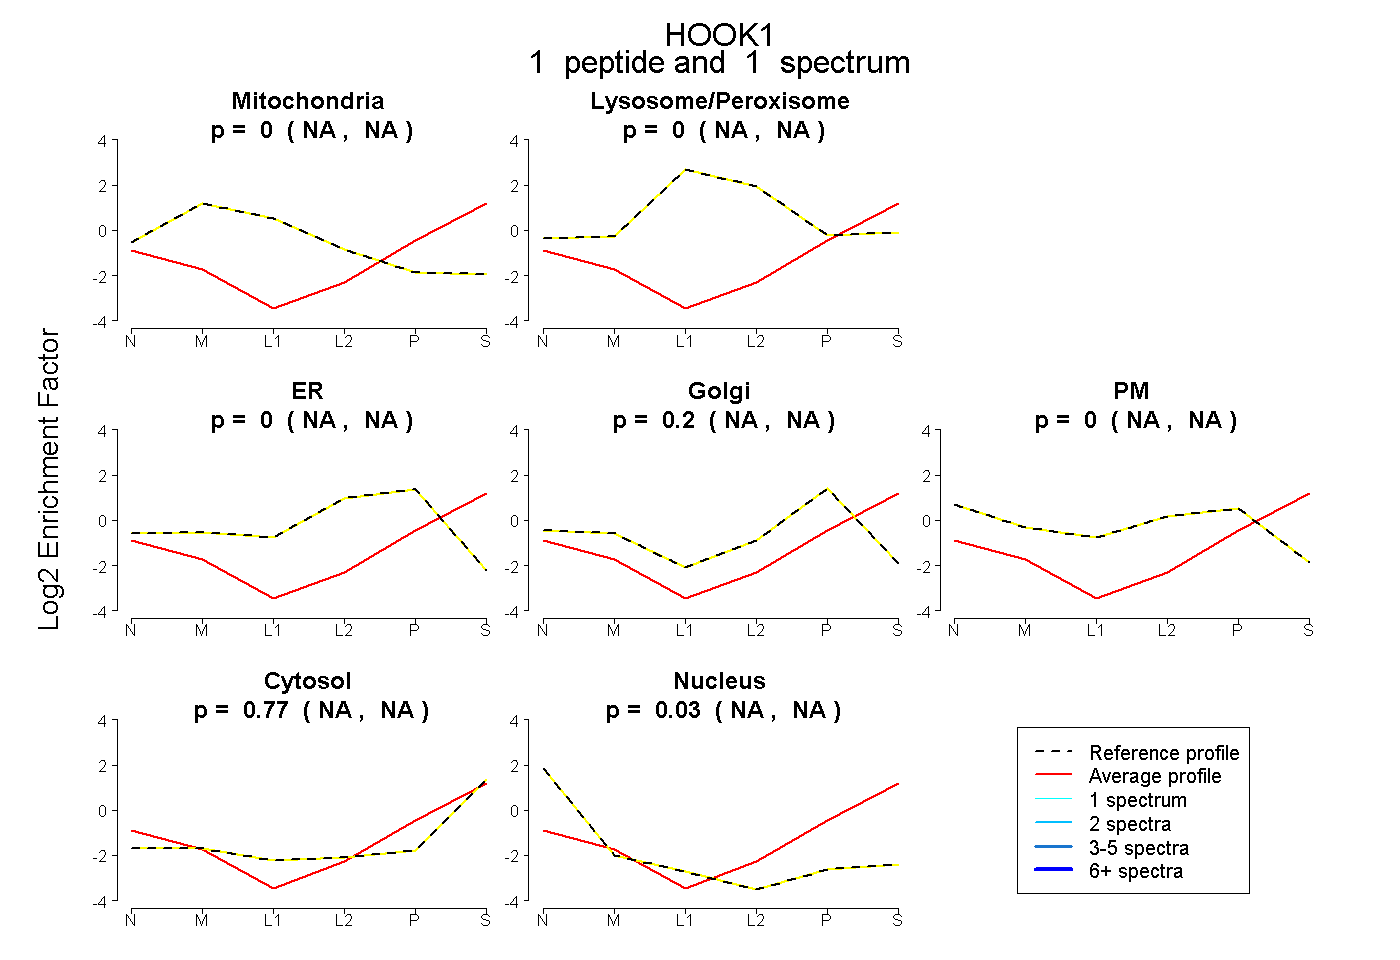
NA | NA
NA | NA
NA | NA
NA | NA
NA | NA
NA | NA
NA | NA
| Plot | Mito | Lyso | Perox | ER | Golgi | PM | Cytosol | Nucleus | |||||
| Expt A |
4 peptides |
6 spectra |
|
0.000 0.000 | 0.079 |
0.000 0.000 | 0.000 |
0.000 0.000 | 0.000 |
0.000 0.000 | 0.000 |
0.148 0.085 | 0.214 |
0.071 0.000 | 0.119 |
0.738 0.696 | 0.761 |
0.044 0.000 | 0.062 |
||
| Plot | Mito | Lyso or Perox | ER | Golgi | PM | Cytosol | Nucleus | ||||||
| Expt B |
1 peptide |
1 spectrum |
|
0.000 NA | NA |
0.000 NA | NA |
0.000 NA | NA |
0.199 NA | NA |
0.000 NA | NA |
0.770 NA | NA |
0.030 NA | NA |
| 1 spectrum, NDELTSLAEETR | 0.000 | 0.000 | 0.000 | 0.199 | 0.000 | 0.770 | 0.030 |
| Plot | Lyso | Other | |||||||||||
| Expt C |
3 peptides |
5 spectra |
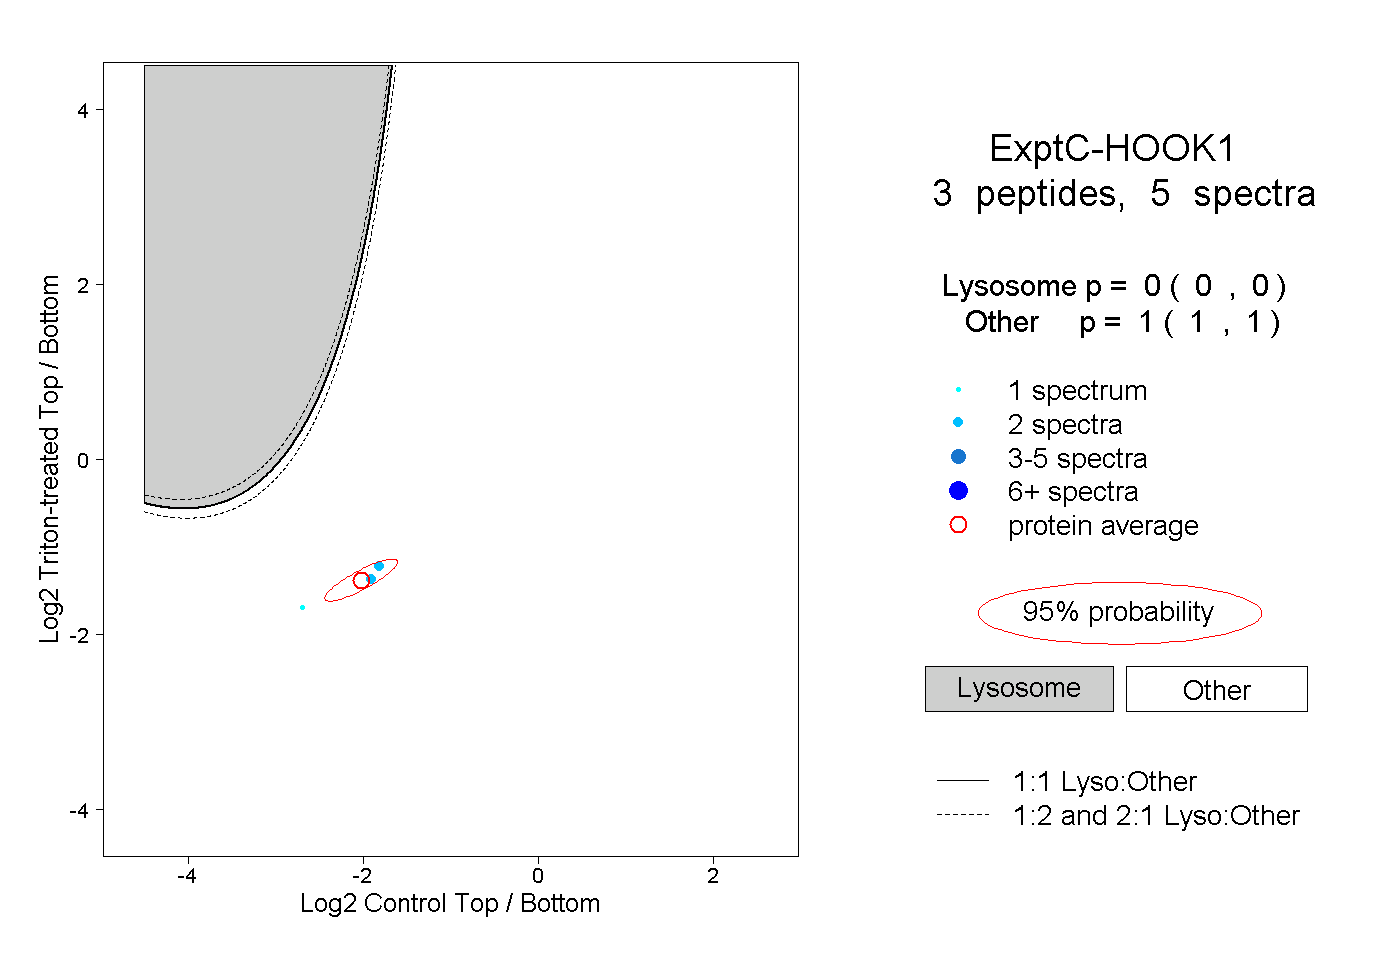 |
0.000 0.000 | 0.000 |
1.000 1.000 | 1.000 |