 7
7peptides
spectra
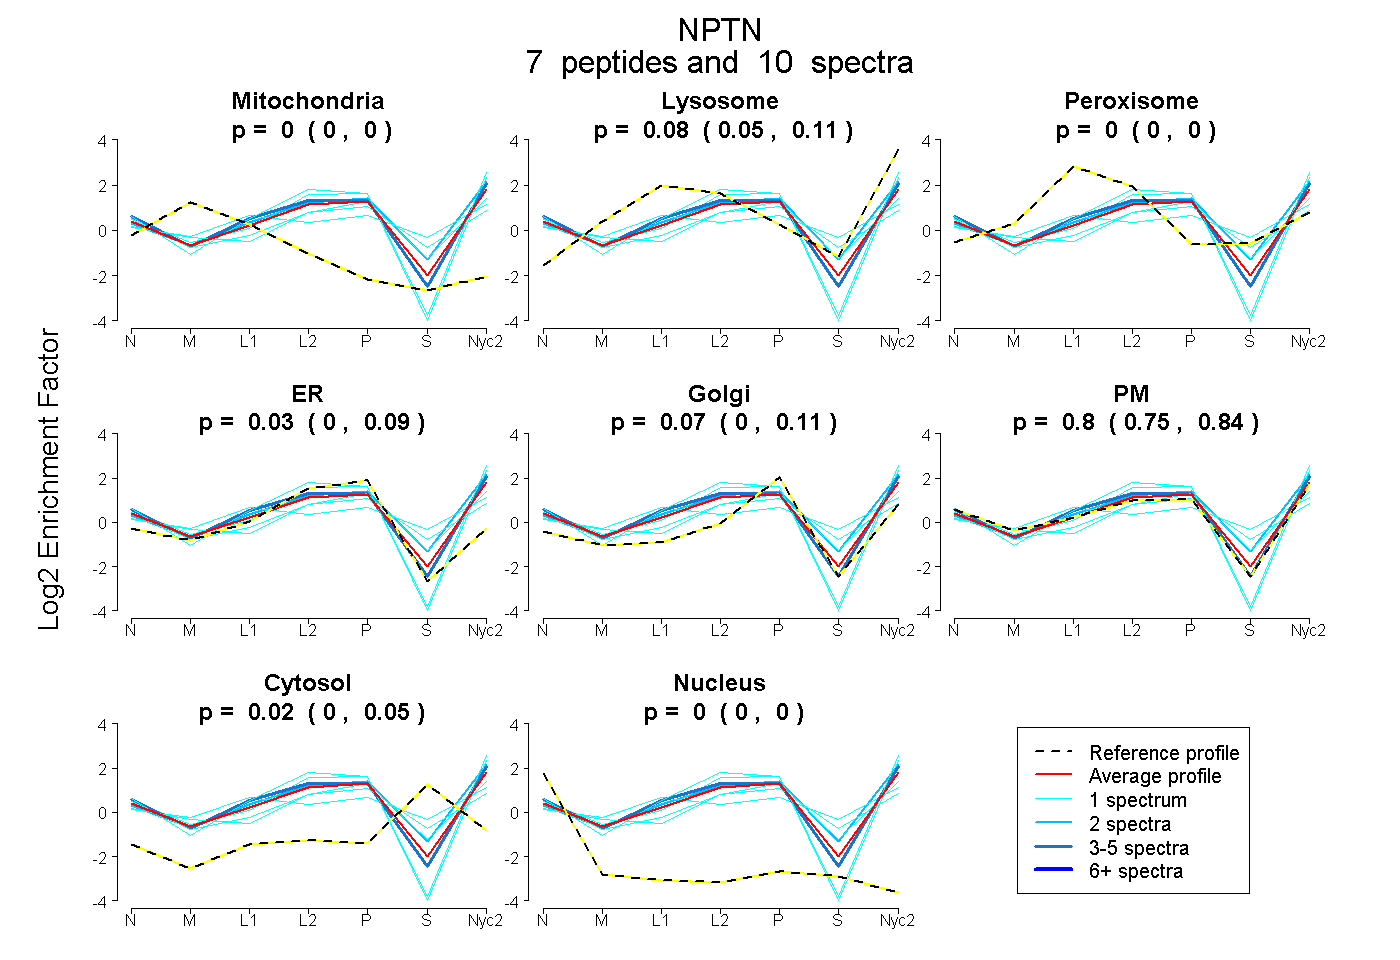
0.000 | 0.000
0.052 | 0.106
0.000 | 0.000
0.000 | 0.088
0.001 | 0.113
0.753 | 0.838
0.000 | 0.046
0.000 | 0.000
1peptide
spectra
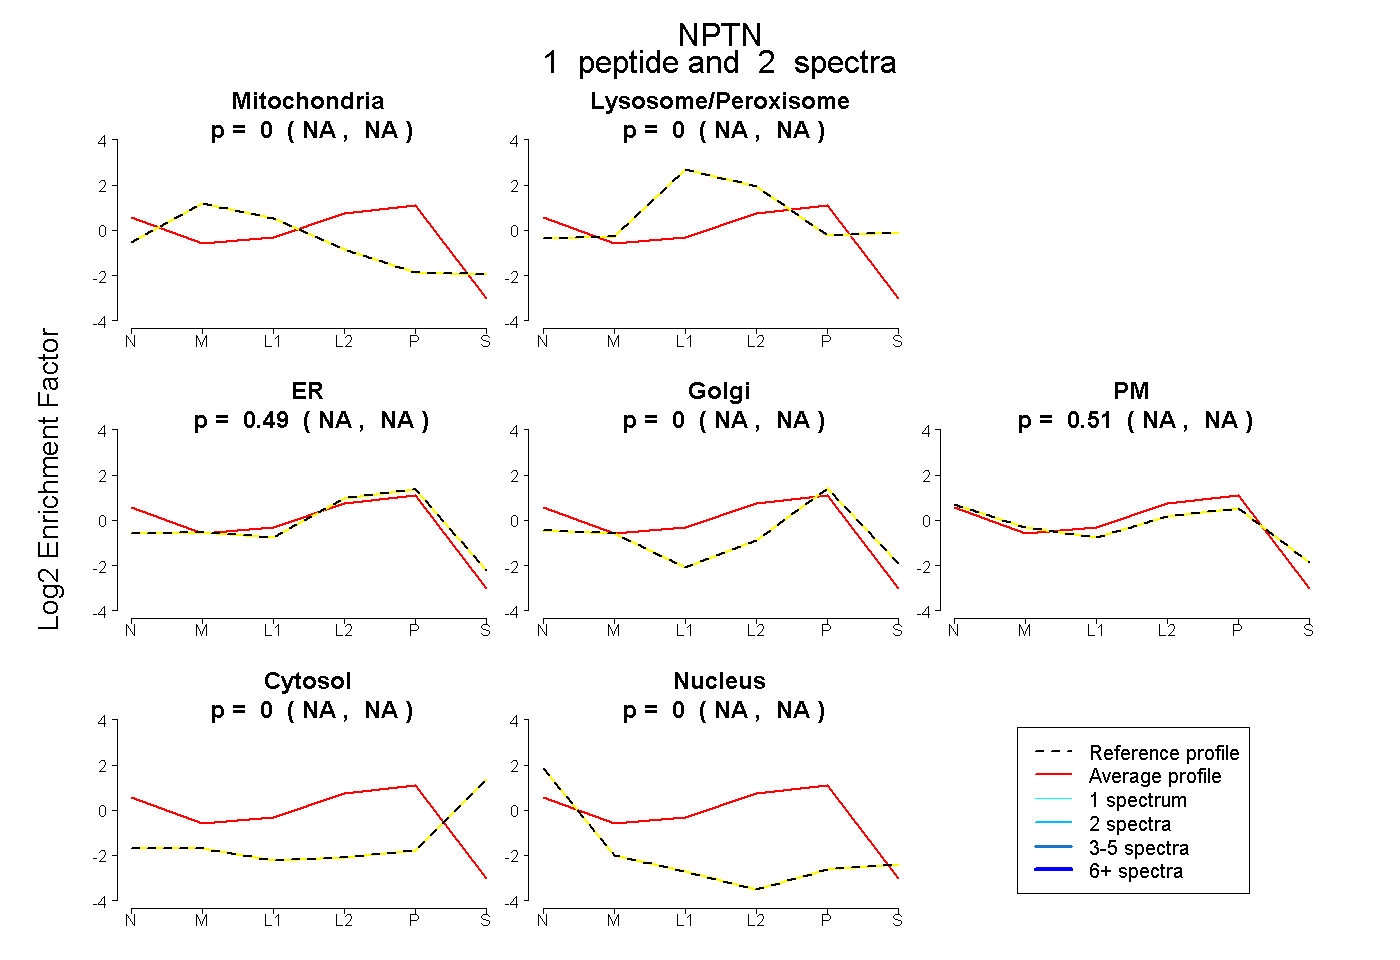
NA | NA
NA | NA
NA | NA
NA | NA
NA | NA
NA | NA
NA | NA
6peptides
spectra
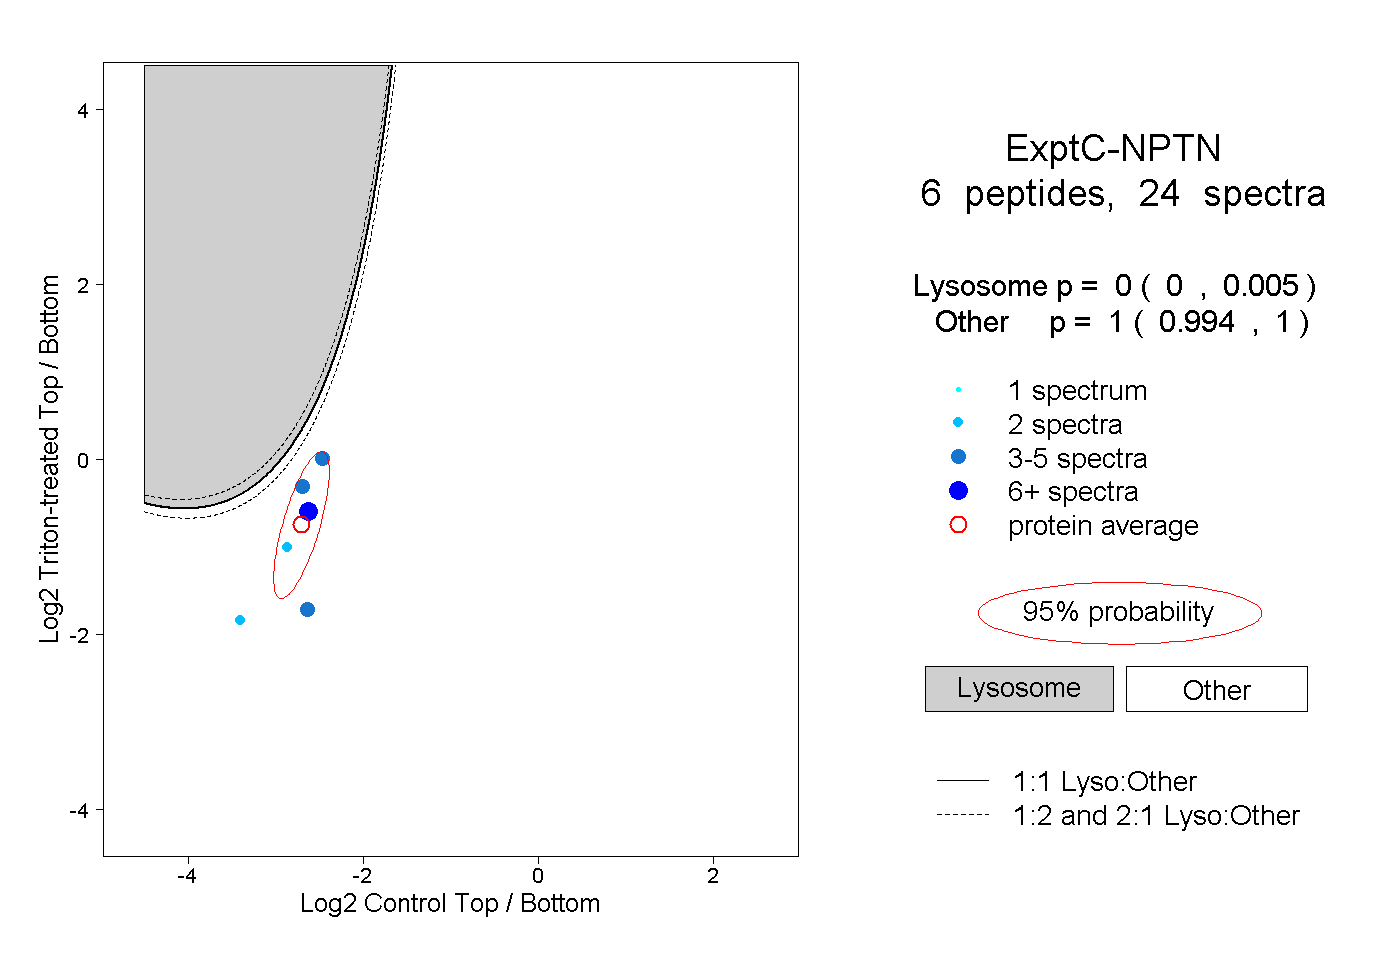
0.000 | 0.005
0.994 | 1.000