 7
7peptides
spectra
0.000 | 0.000
0.052 | 0.106
0.000 | 0.000
0.000 | 0.088
0.001 | 0.113
0.753 | 0.838
0.000 | 0.046
0.000 | 0.000
| Plot | Mito | Lyso | Perox | ER | Golgi | PM | Cytosol | Nucleus | |||||
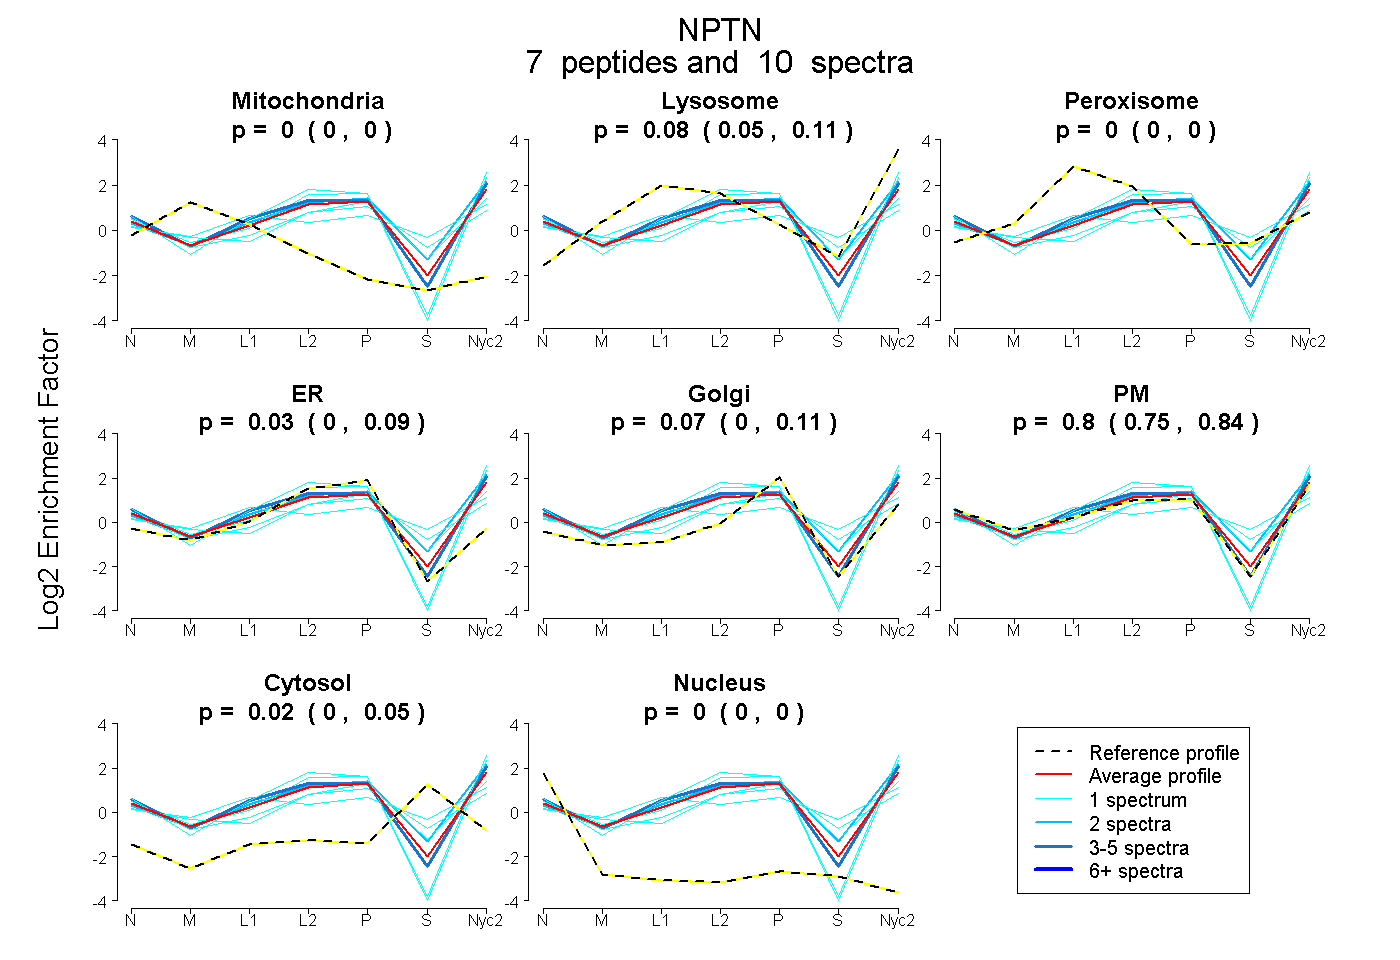
| Expt A |
7 peptides |
10 spectra |
|
0.000 0.000 | 0.000 |
0.081 0.052 | 0.106 |
0.000 0.000 | 0.000 |
0.034 0.000 | 0.088 |
0.067 0.001 | 0.113 |
0.800 0.753 | 0.838 |
0.018 0.000 | 0.046 |
0.000 0.000 | 0.000 |
| 3 spectra, IVTSEEVIIR | 0.000 | 0.070 | 0.000 | 0.000 | 0.000 | 0.930 | 0.000 | 0.000 | ||
| 2 spectra, AAPDITGHK | 0.000 | 0.214 | 0.000 | 0.000 | 0.072 | 0.666 | 0.048 | 0.000 | ||
| 1 spectrum, SVGYPHPEWMWR | 0.000 | 0.012 | 0.000 | 0.000 | 0.099 | 0.747 | 0.142 | 0.000 | ||
| 1 spectrum, NGVELTATR | 0.000 | 0.000 | 0.000 | 0.000 | 0.000 | 1.000 | 0.000 | 0.000 | ||
| 1 spectrum, AEDSGEYHCVYHFVSAPK | 0.000 | 0.074 | 0.249 | 0.000 | 0.054 | 0.406 | 0.217 | 0.000 | ||
| 1 spectrum, RPDEVPDDDEPAGPMK | 0.000 | 0.019 | 0.039 | 0.109 | 0.054 | 0.556 | 0.222 | 0.000 | ||
| 1 spectrum, FFIINK | 0.000 | 0.000 | 0.000 | 0.000 | 0.000 | 1.000 | 0.000 | 0.000 |
| Plot | Mito | Lyso or Perox | ER | Golgi | PM | Cytosol | Nucleus | ||||||
| Expt B |
1 peptide |
2 spectra |
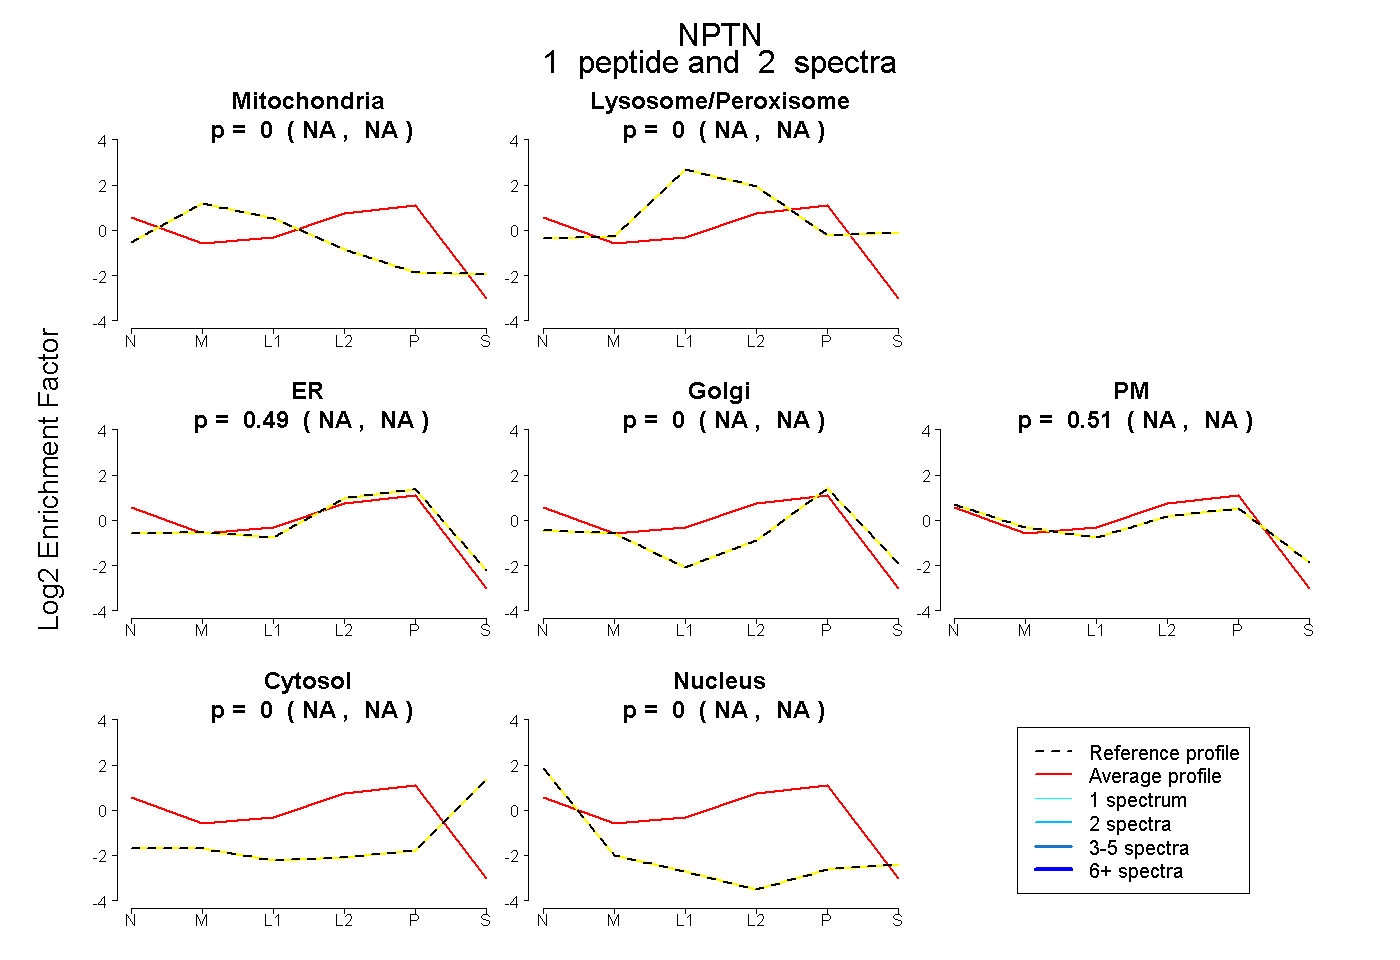 |
0.000 NA | NA |
0.000 NA | NA |
0.490 NA | NA |
0.000 NA | NA |
0.510 NA | NA |
0.000 NA | NA |
0.000 NA | NA |
|||
| Plot | Lyso | Other | |||||||||||
| Expt C |
6 peptides |
24 spectra |
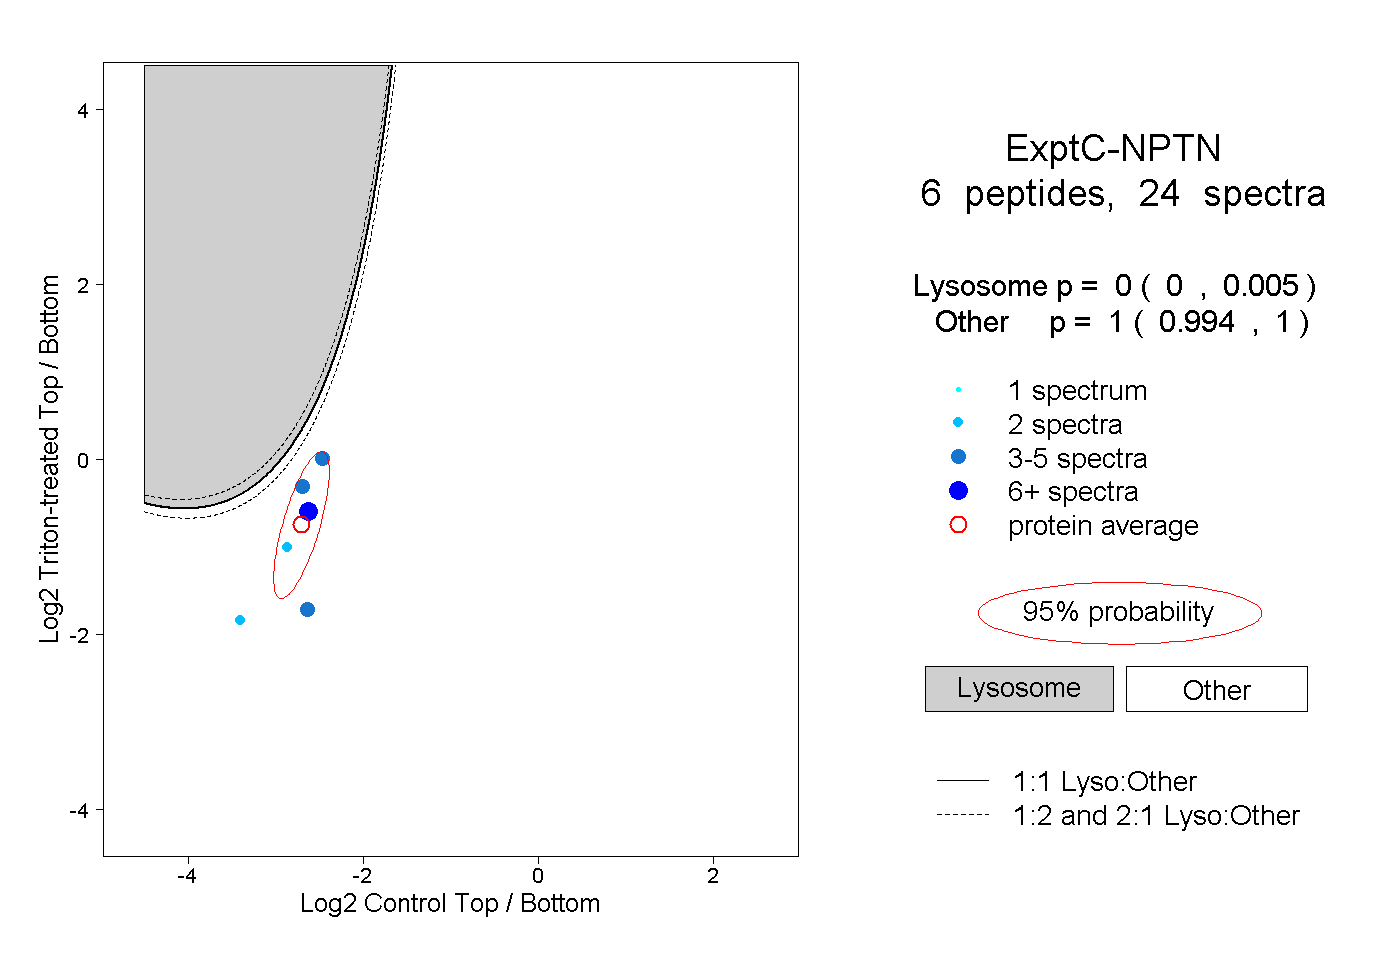 |
0.000 0.000 | 0.005 |
1.000 0.994 | 1.000 |