 4
4peptides
spectra
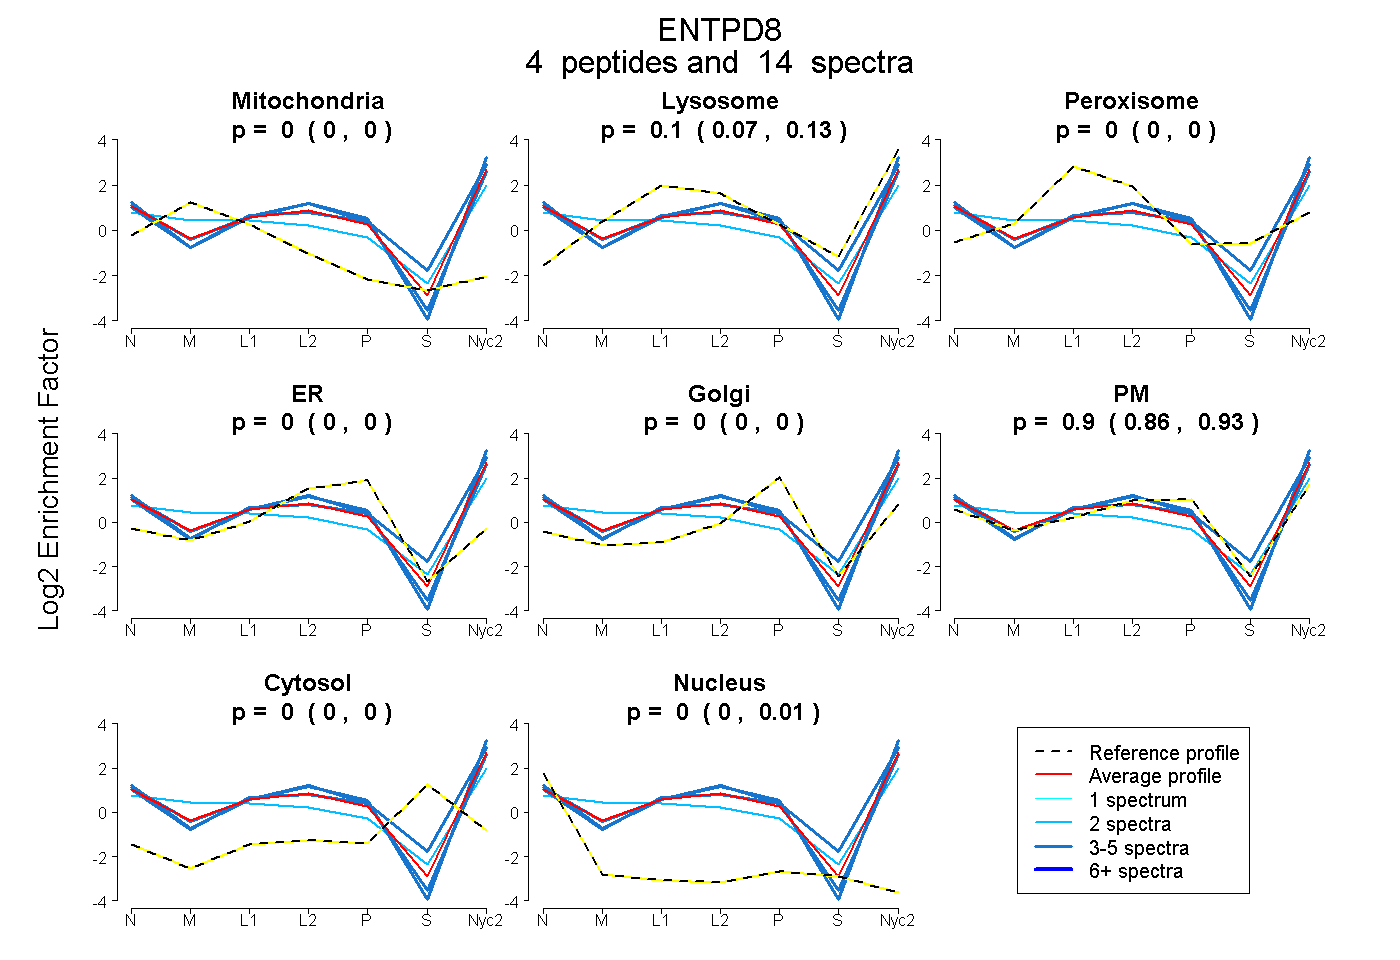
0.000 | 0.000
0.069 | 0.129
0.000 | 0.000
0.000 | 0.000
0.000 | 0.000
0.859 | 0.926
0.000 | 0.000
0.000 | 0.008
3peptides
spectra
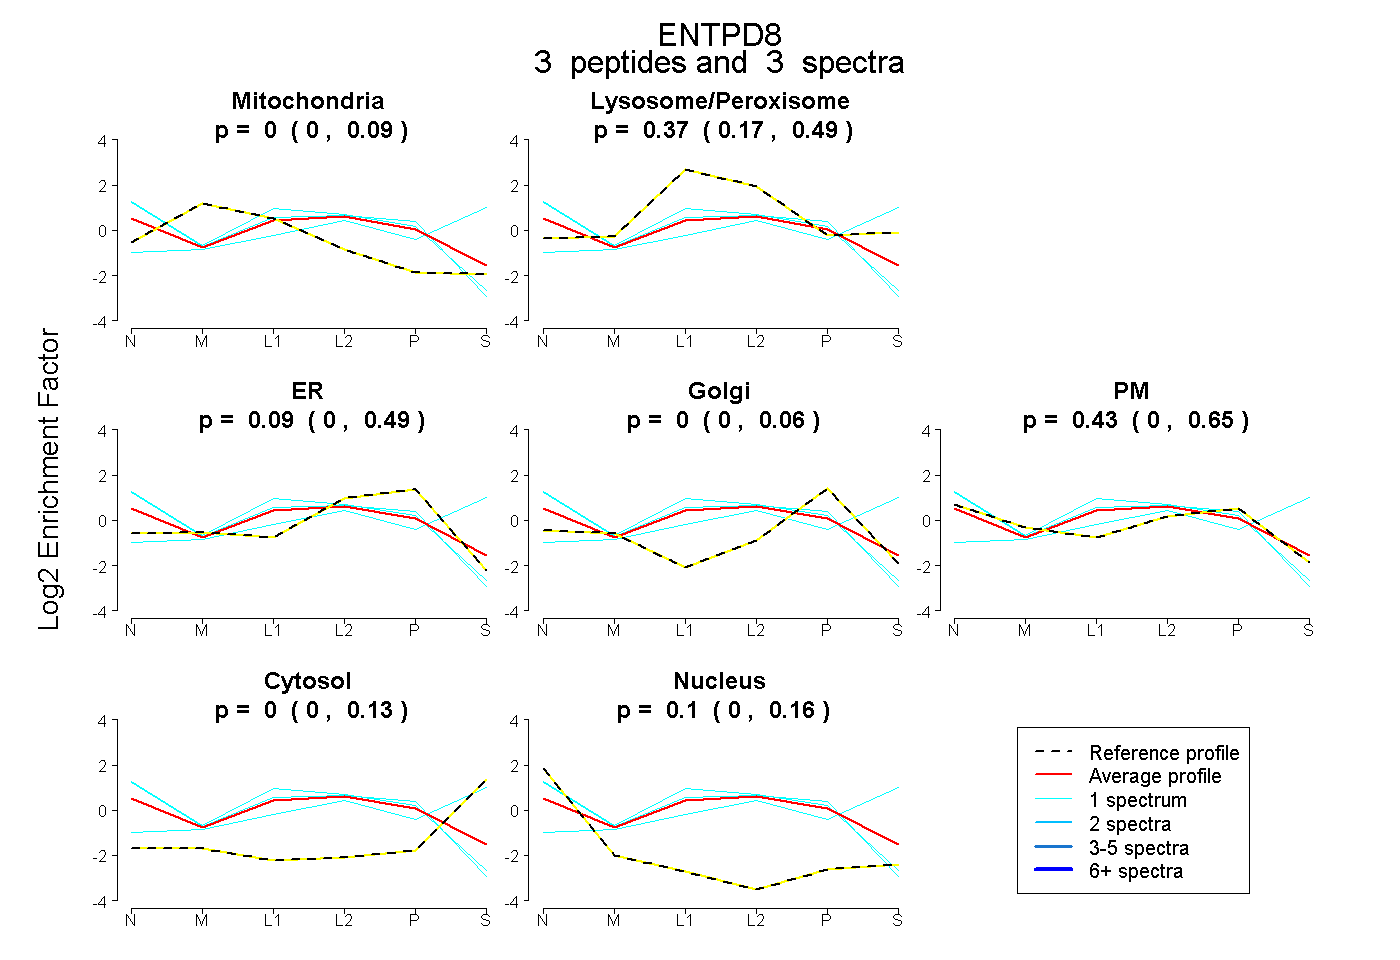
0.000 | 0.086
0.171 | 0.490
0.000 | 0.487
0.000 | 0.062
0.000 | 0.652
0.000 | 0.134
0.000 | 0.164
5peptides
spectra
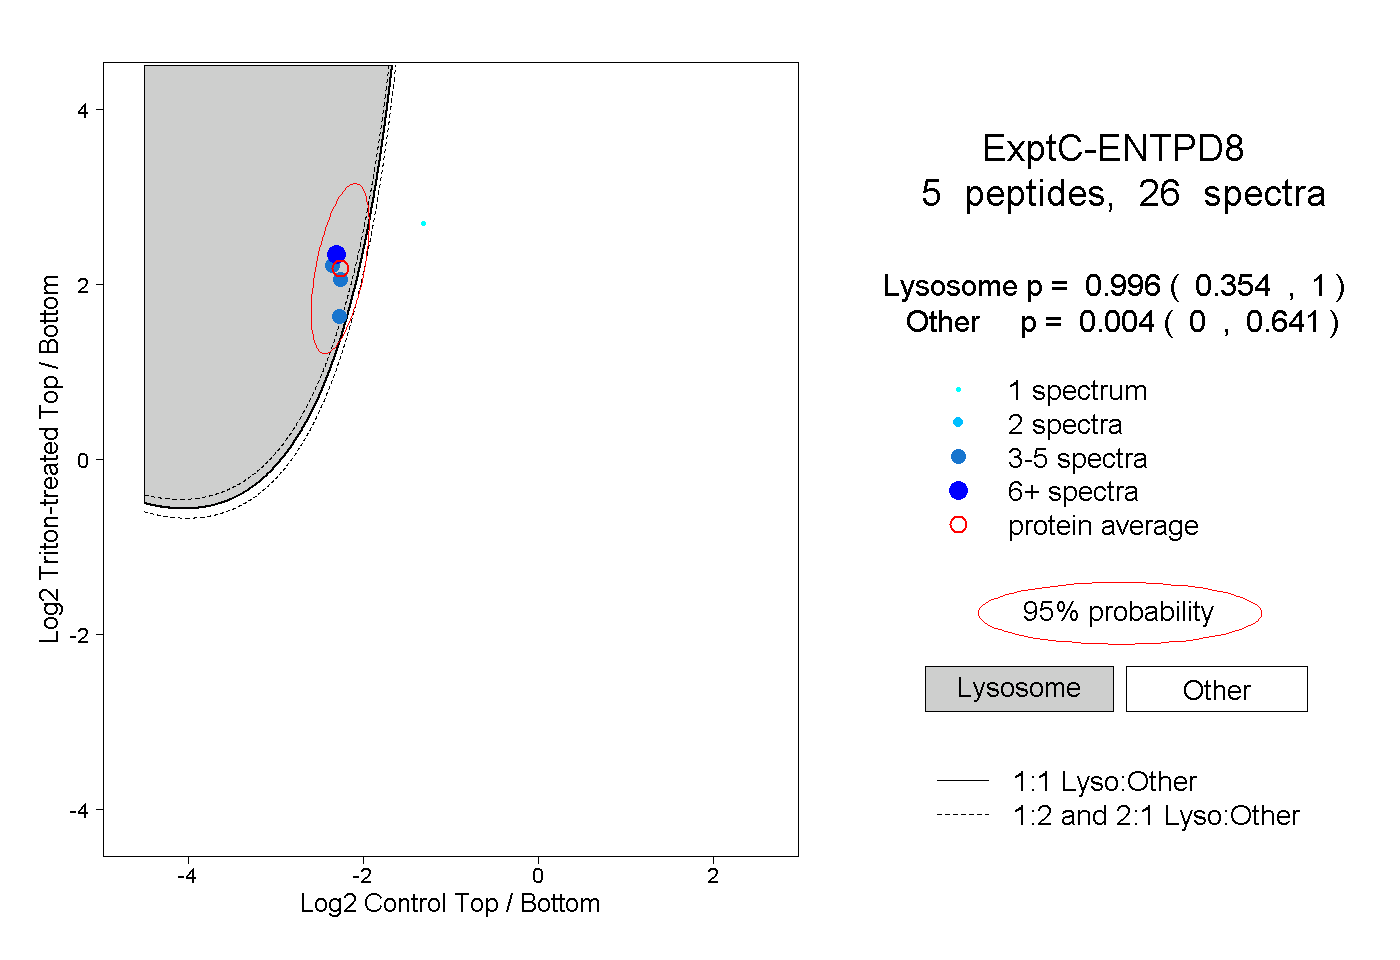
0.354 | 1.000
0.000 | 0.641
4peptides
spectra
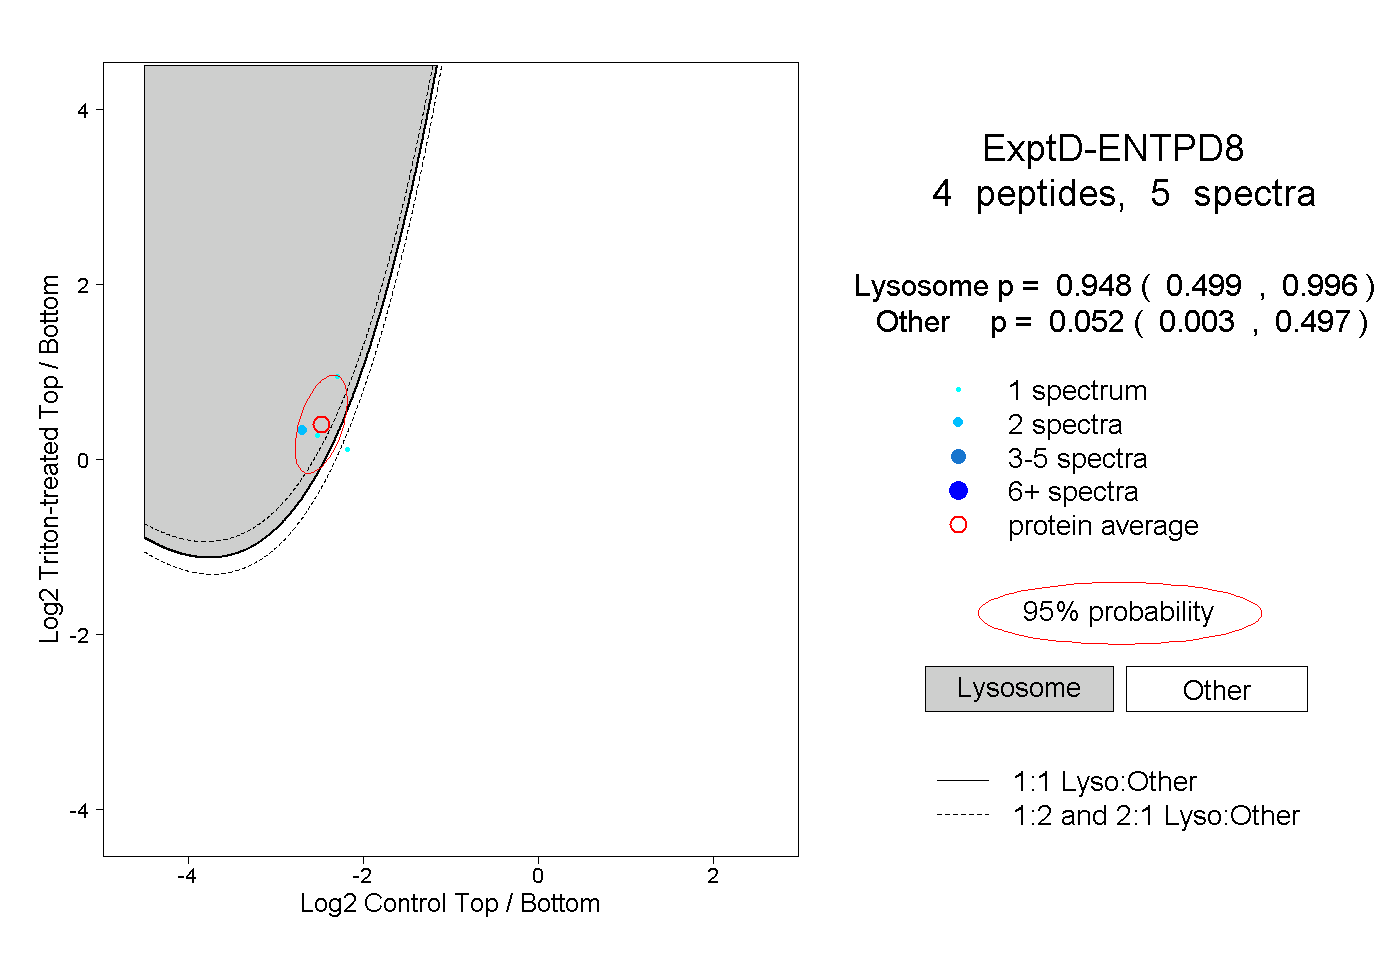
0.499 | 0.996
0.003 | 0.497