 4
4peptides
spectra
0.000 | 0.000
0.069 | 0.129
0.000 | 0.000
0.000 | 0.000
0.000 | 0.000
0.859 | 0.926
0.000 | 0.000
0.000 | 0.008
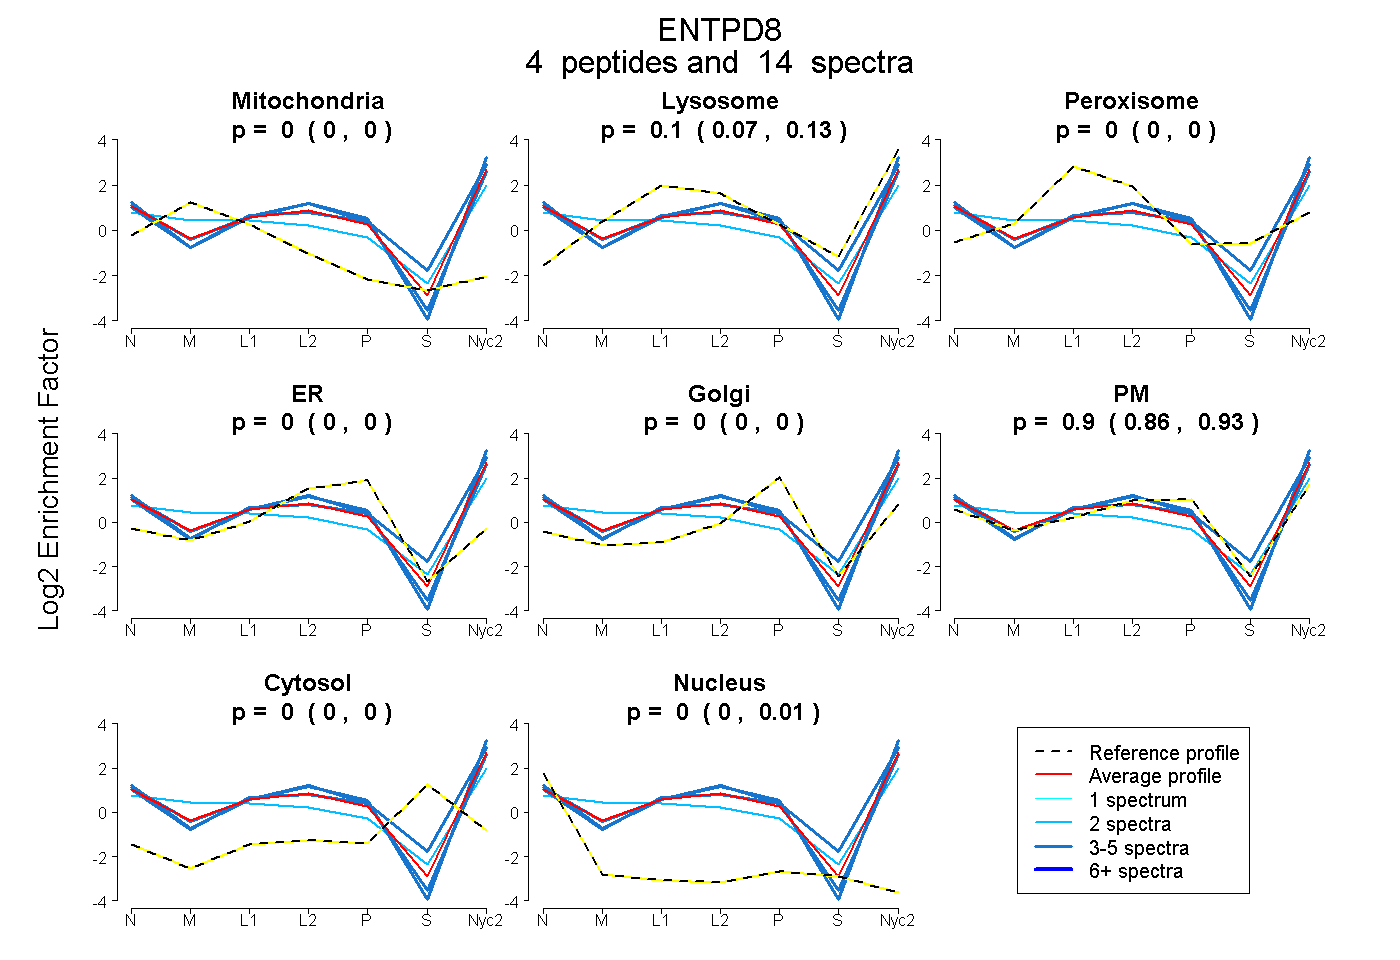
| Plot | Mito | Lyso | Perox | ER | Golgi | PM | Cytosol | Nucleus | |||||
| Expt A |
4 peptides |
14 spectra |
|
0.000 0.000 | 0.000 |
0.100 0.069 | 0.129 |
0.000 0.000 | 0.000 |
0.000 0.000 | 0.000 |
0.000 0.000 | 0.000 |
0.900 0.859 | 0.926 |
0.000 0.000 | 0.000 |
0.000 0.000 | 0.008 |
| 2 spectra, APVDFWGAR | 0.181 | 0.191 | 0.000 | 0.000 | 0.000 | 0.605 | 0.000 | 0.022 | ||
| 5 spectra, LVEDSYPGQER | 0.000 | 0.236 | 0.000 | 0.000 | 0.000 | 0.748 | 0.000 | 0.016 | ||
| 4 spectra, FCQKPWR | 0.000 | 0.000 | 0.000 | 0.000 | 0.000 | 1.000 | 0.000 | 0.000 | ||
| 3 spectra, LLAELVQSSQVAR | 0.000 | 0.066 | 0.000 | 0.000 | 0.000 | 0.934 | 0.000 | 0.000 |
| Plot | Mito | Lyso or Perox | ER | Golgi | PM | Cytosol | Nucleus | ||||||
| Expt B |
3 peptides |
3 spectra |
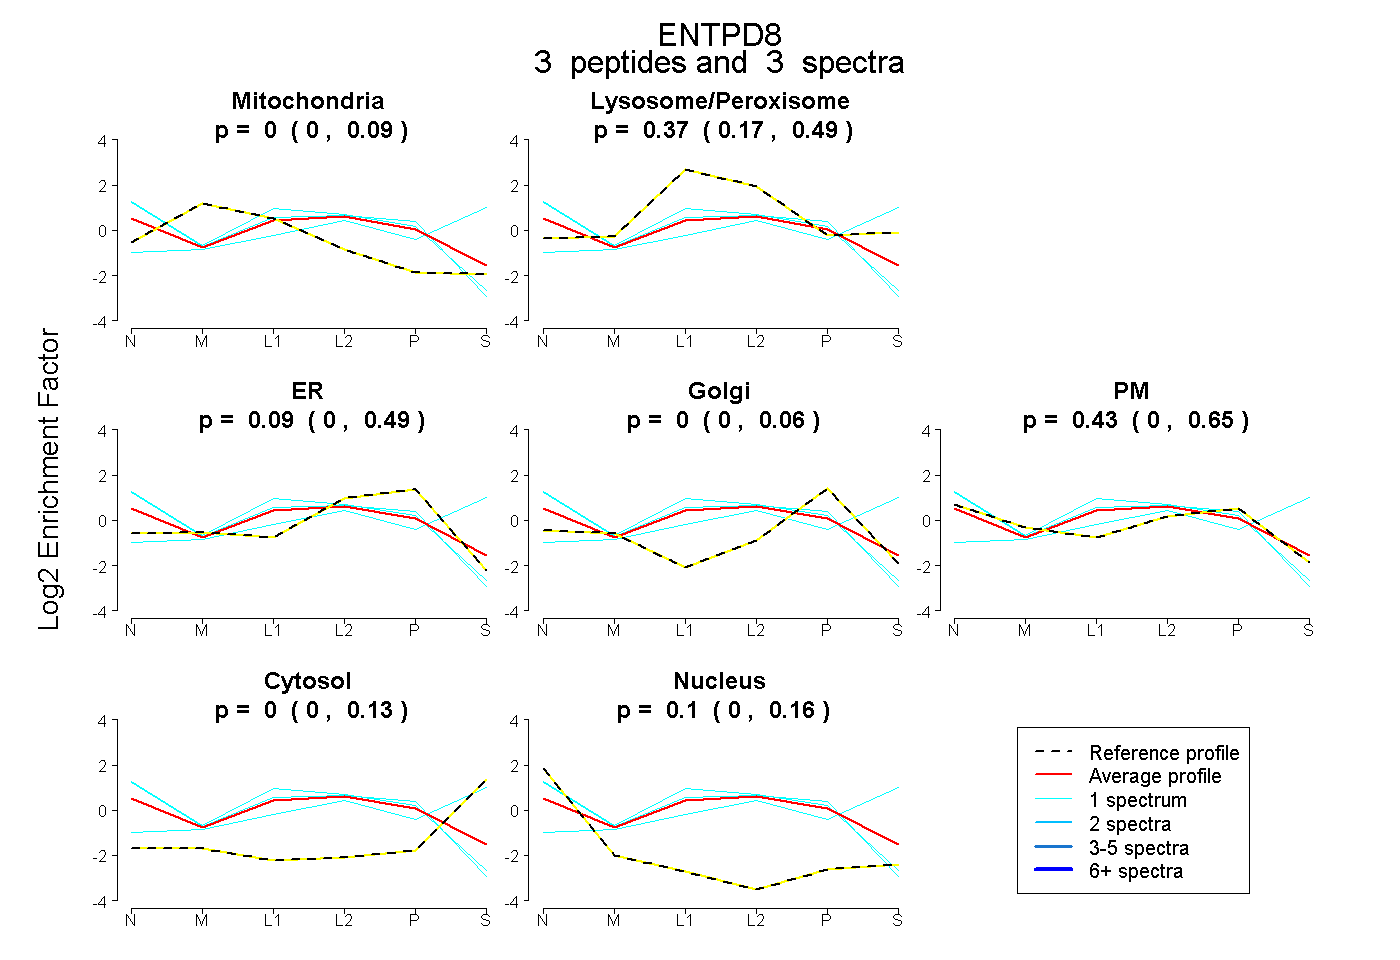 |
0.000 0.000 | 0.086 |
0.367 0.171 | 0.490 |
0.094 0.000 | 0.487 |
0.000 0.000 | 0.062 |
0.435 0.000 | 0.652 |
0.000 0.000 | 0.134 |
0.104 0.000 | 0.164 |
|||
| Plot | Lyso | Other | |||||||||||
| Expt C |
5 peptides |
26 spectra |
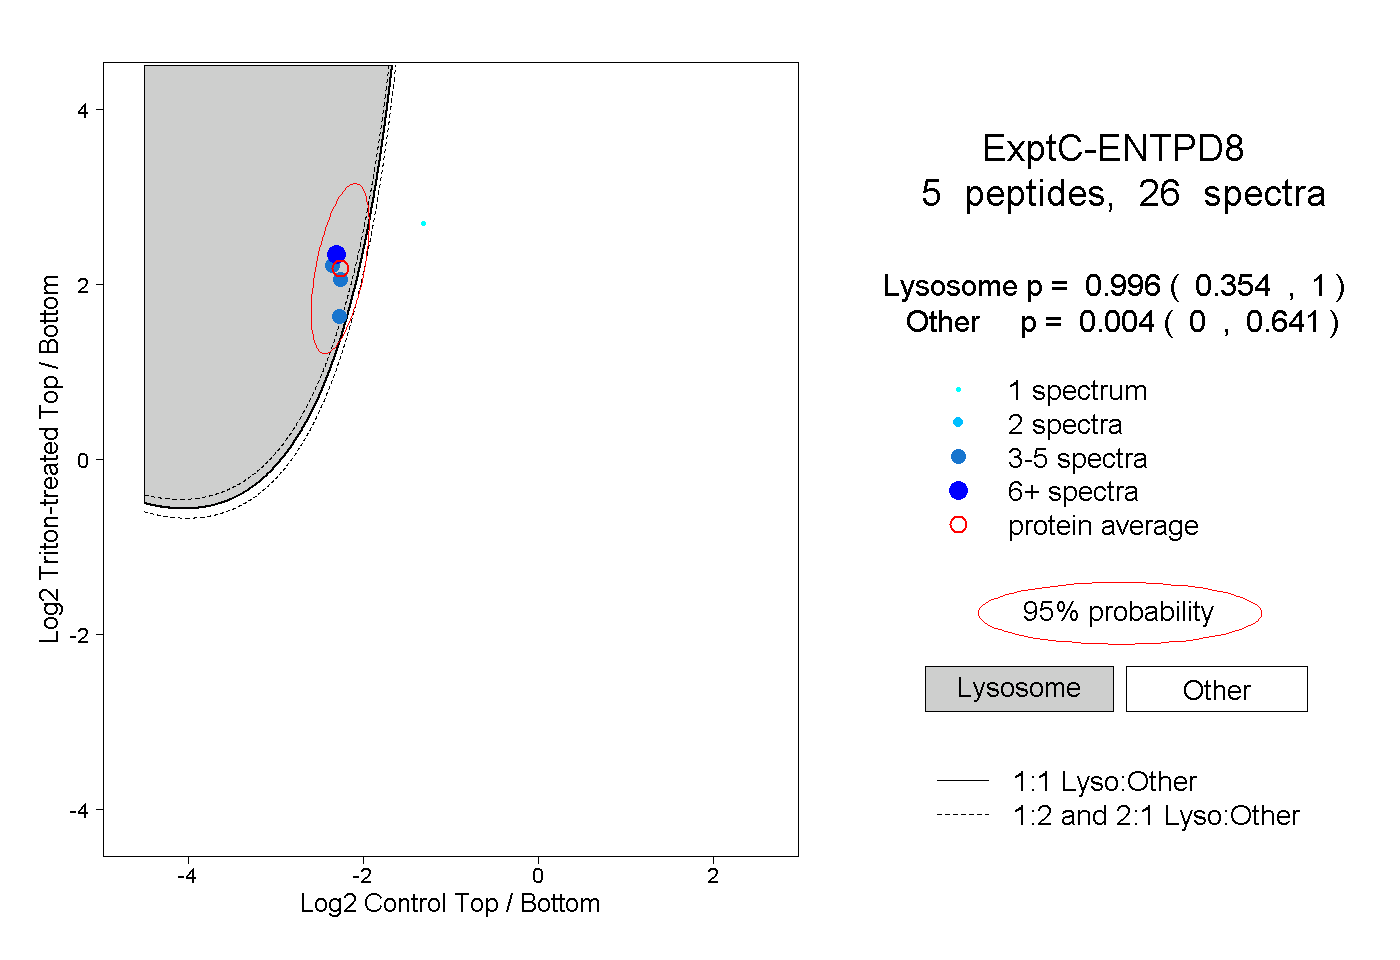 |
0.996 0.354 | 1.000 |
0.004 0.000 | 0.641 |
||||||||
| Plot | Lyso | Other | |||||||||||
| Expt D |
4 peptides |
5 spectra |
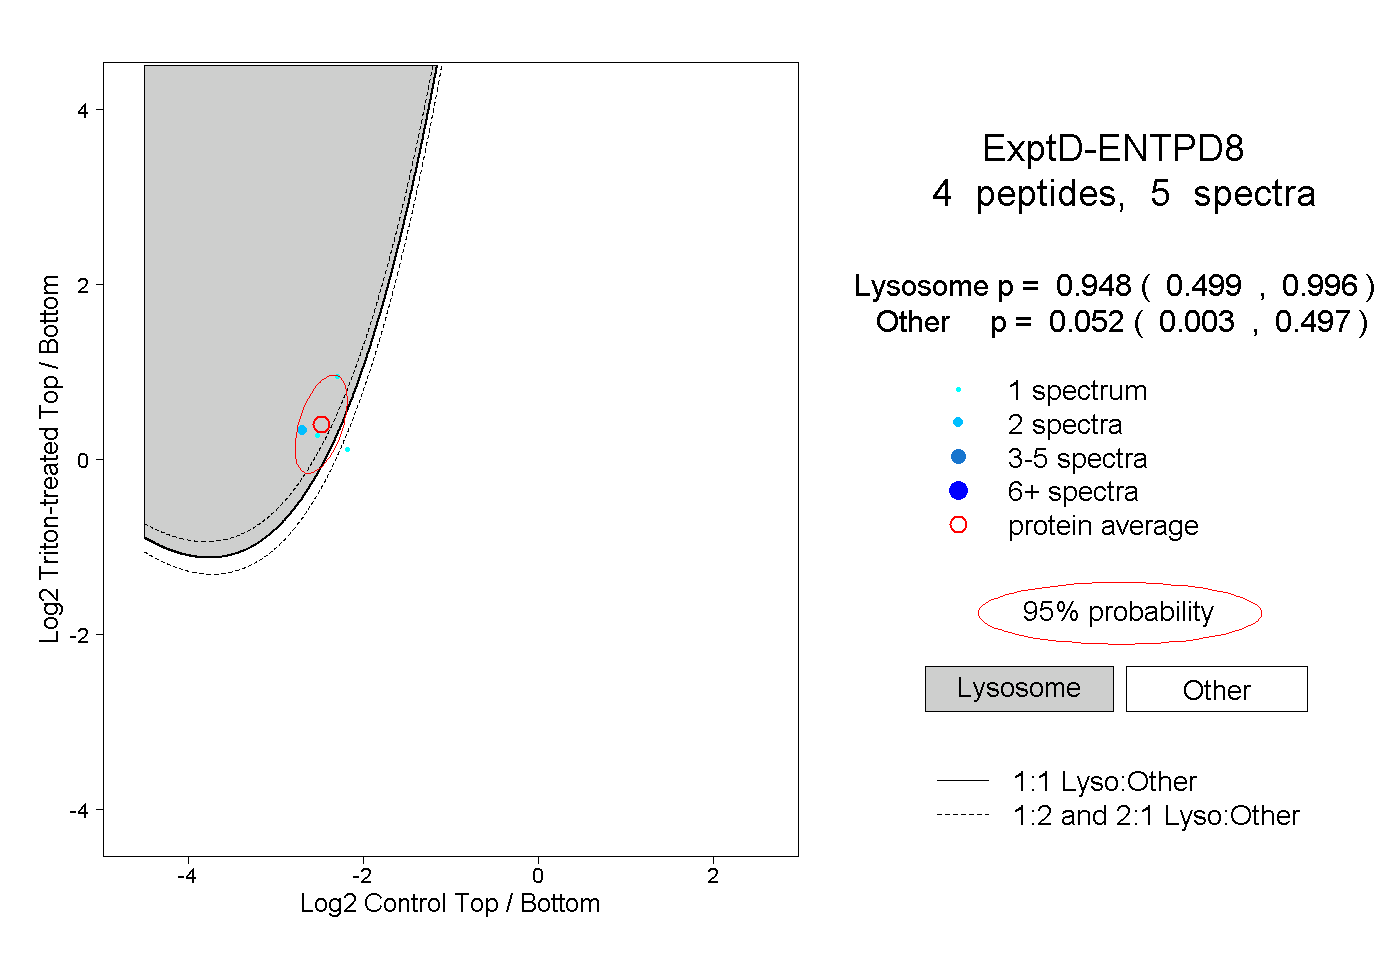 |
0.948 0.499 | 0.996 |
0.052 0.003 | 0.497 |