 7
7peptides
spectra
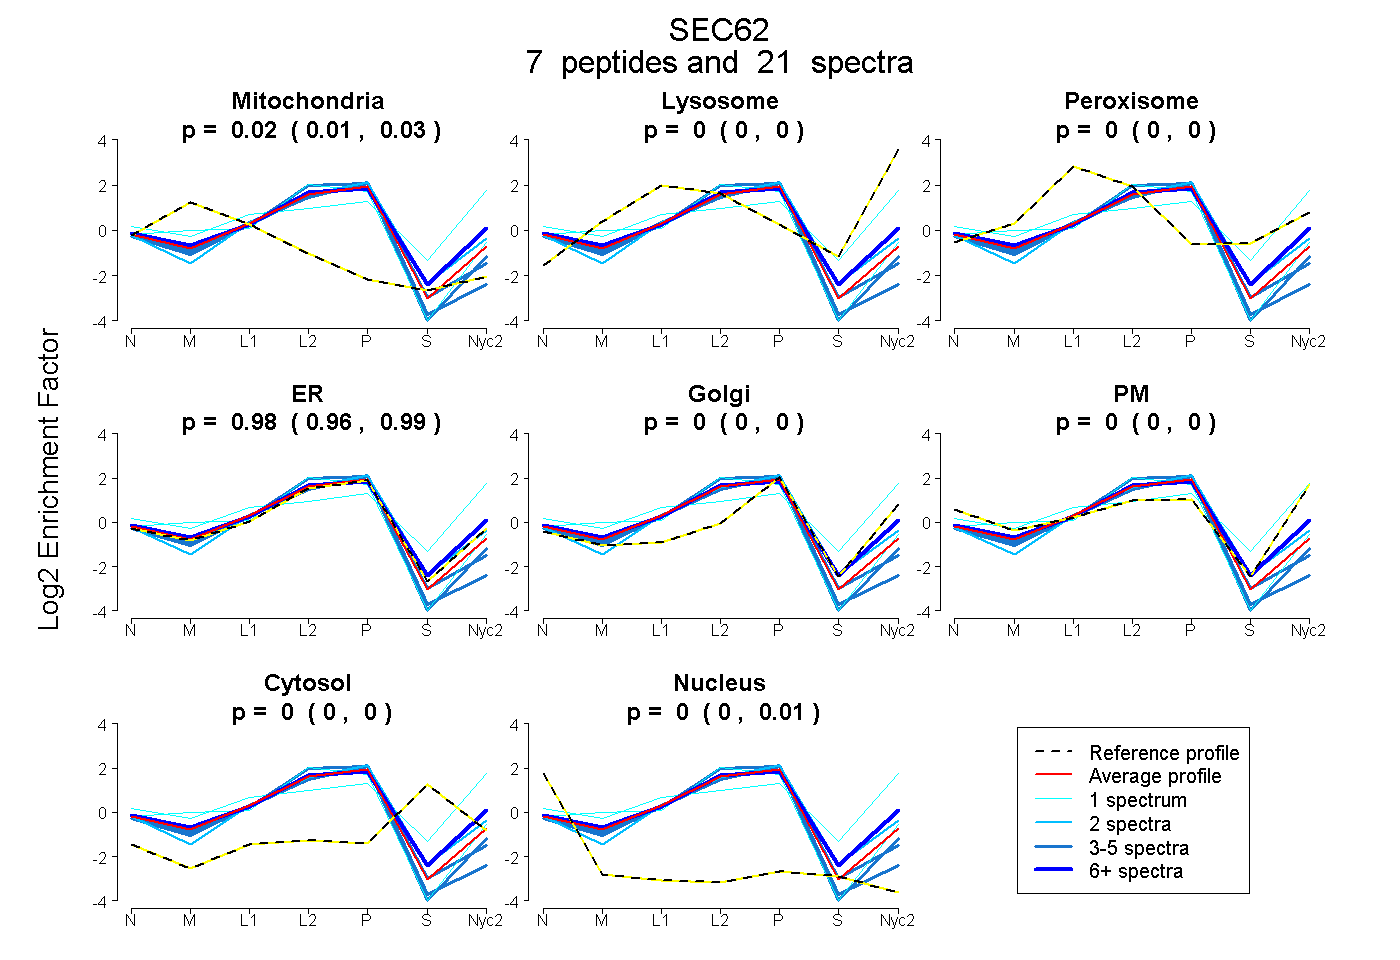
0.007 | 0.032
0.000 | 0.000
0.000 | 0.000
0.962 | 0.989
0.000 | 0.000
0.000 | 0.000
0.000 | 0.000
0.000 | 0.009
3peptides
spectra
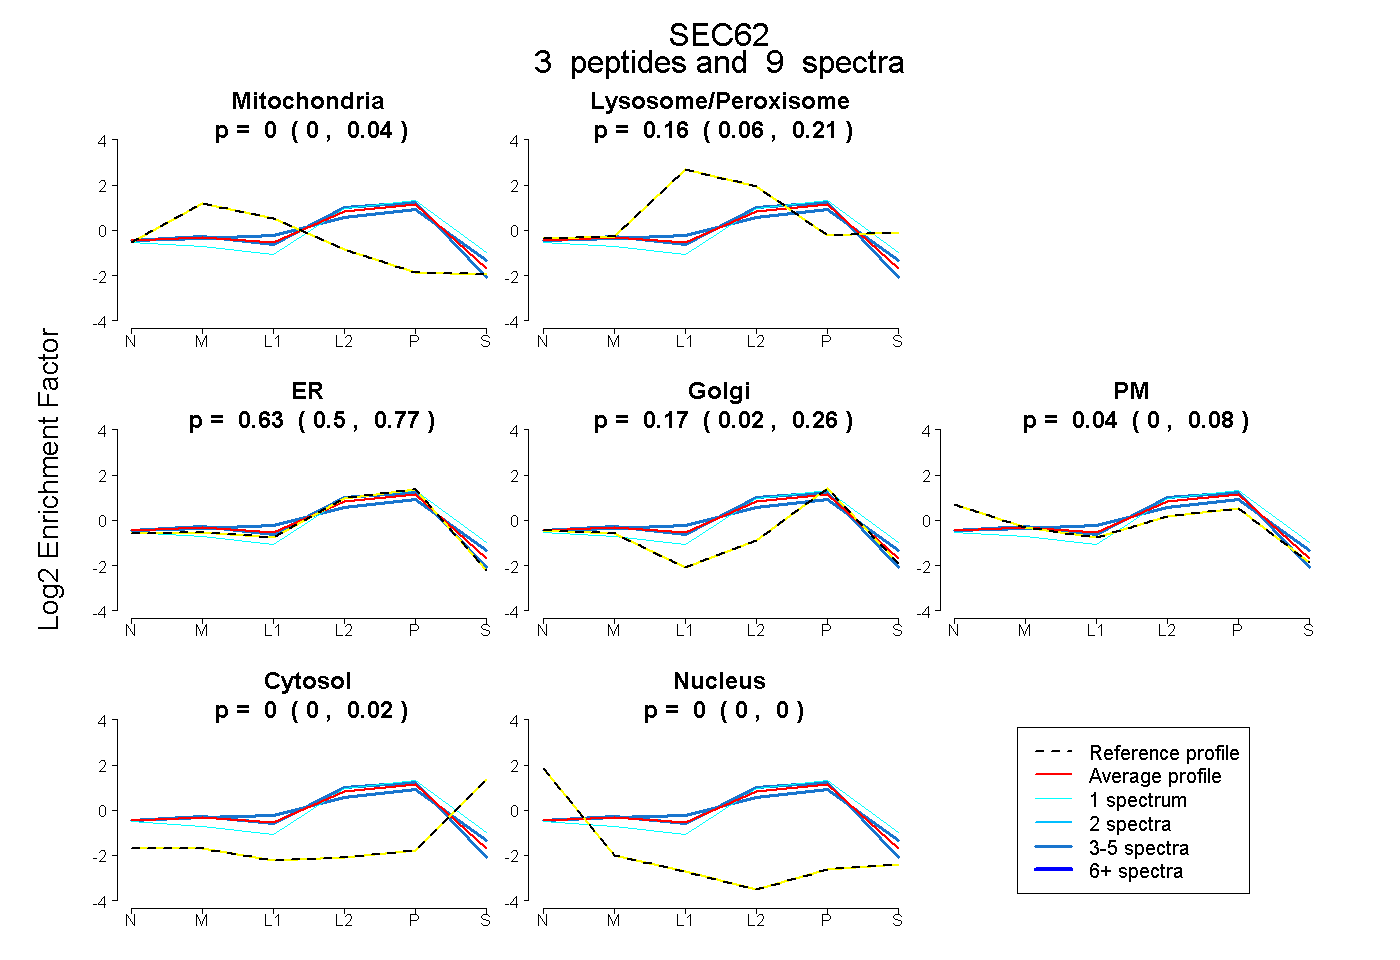
0.000 | 0.038
0.065 | 0.210
0.498 | 0.766
0.020 | 0.262
0.000 | 0.084
0.000 | 0.024
0.000 | 0.000
9peptides
spectra
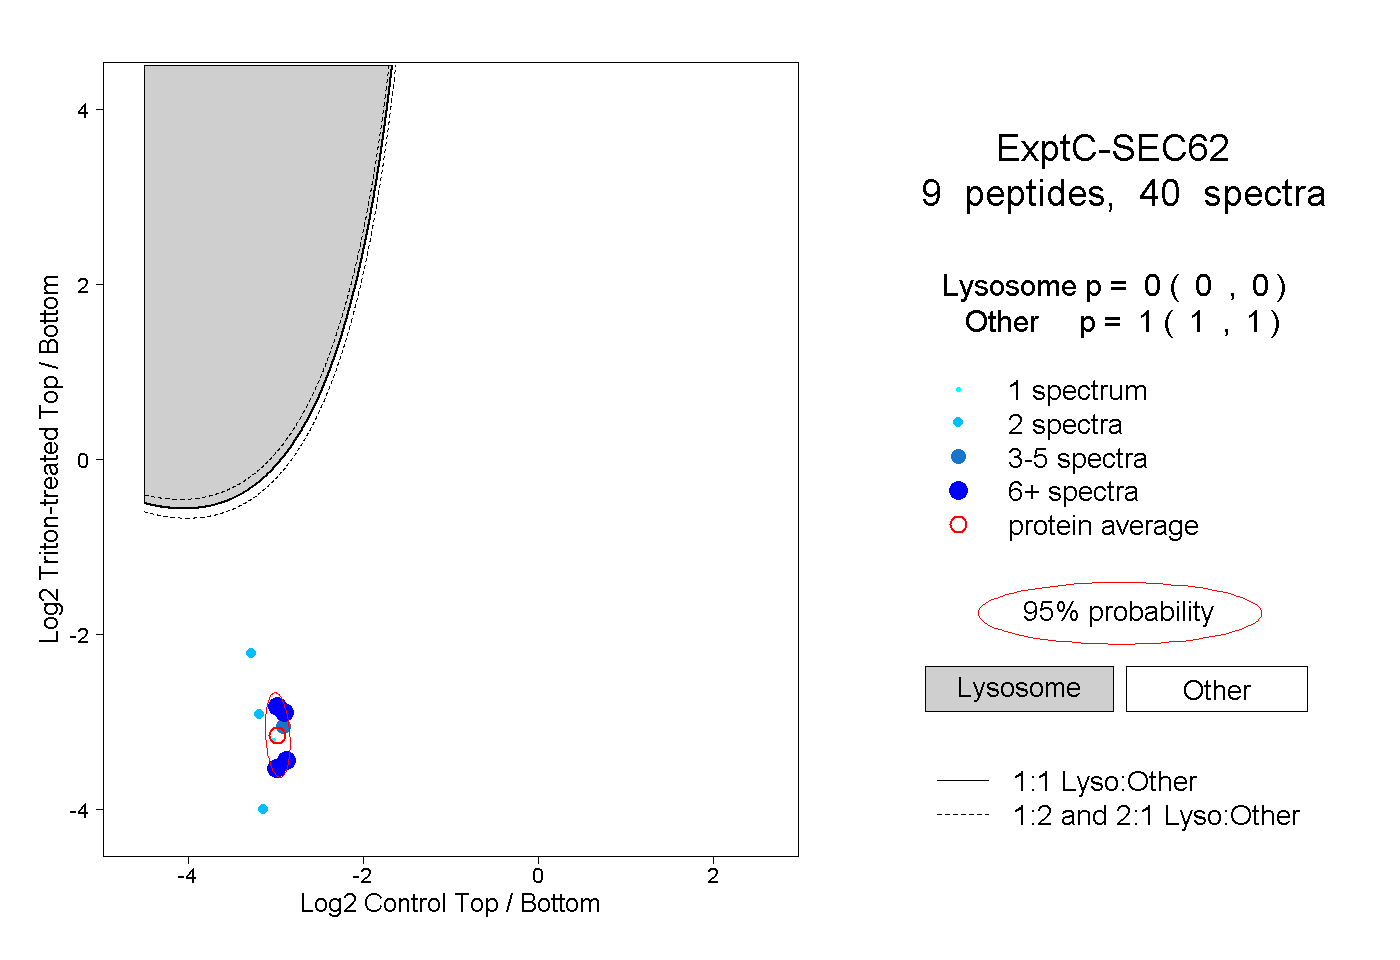
0.000 | 0.000
1.000 | 1.000
3peptides
spectra
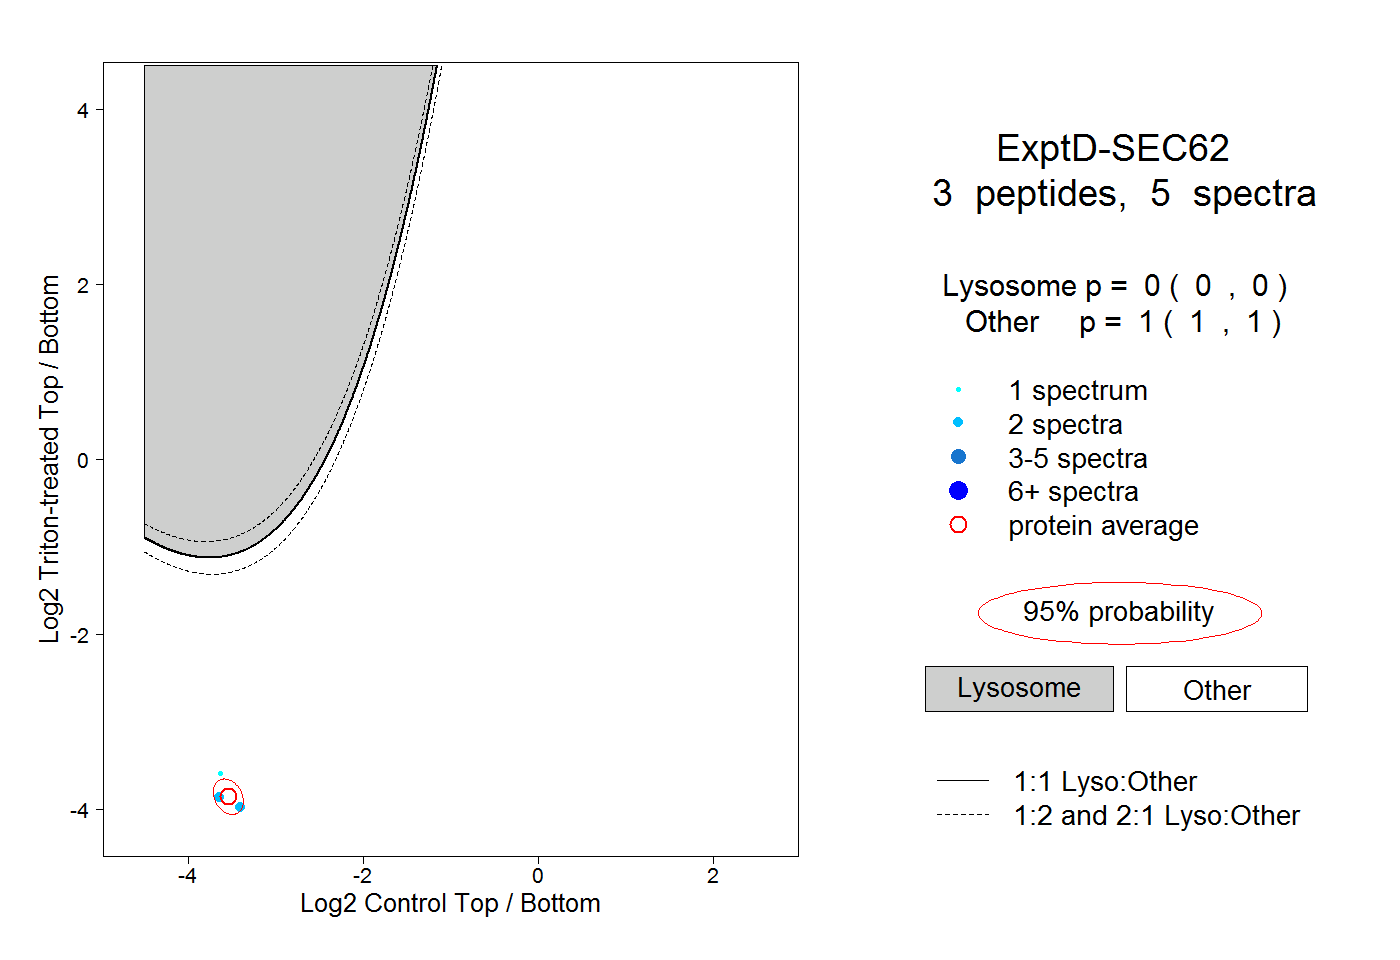
0.000 | 0.000
1.000 | 1.000