 7
7peptides
spectra
0.007 | 0.032
0.000 | 0.000
0.000 | 0.000
0.962 | 0.989
0.000 | 0.000
0.000 | 0.000
0.000 | 0.000
0.000 | 0.009
| Plot | Mito | Lyso | Perox | ER | Golgi | PM | Cytosol | Nucleus | |||||
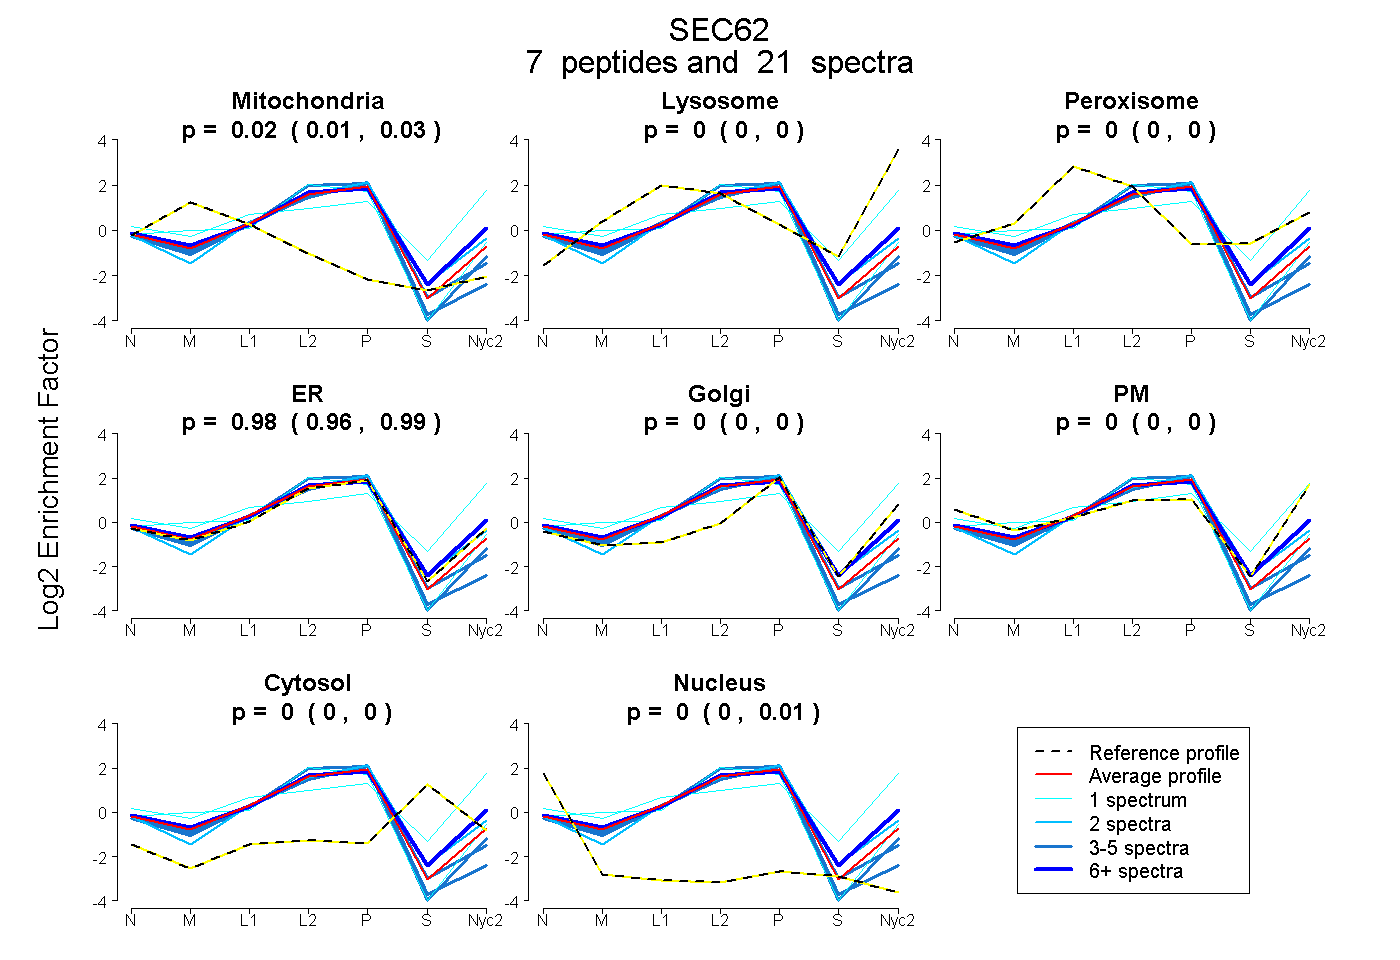
| Expt A |
7 peptides |
21 spectra |
|
0.023 0.007 | 0.032 |
0.000 0.000 | 0.000 |
0.000 0.000 | 0.000 |
0.977 0.962 | 0.989 |
0.000 0.000 | 0.000 |
0.000 0.000 | 0.000 |
0.000 0.000 | 0.000 |
0.000 0.000 | 0.009 |
| 6 spectra, VDYFIASK | 0.000 | 0.018 | 0.051 | 0.844 | 0.000 | 0.088 | 0.000 | 0.000 | ||
| 4 spectra, FNCPTK | 0.000 | 0.000 | 0.000 | 0.998 | 0.000 | 0.000 | 0.000 | 0.002 | ||
| 1 spectrum, STNMMGHR | 0.000 | 0.161 | 0.148 | 0.000 | 0.193 | 0.483 | 0.014 | 0.000 | ||
| 1 spectrum, GAPGDHGPEGSGGER | 0.055 | 0.000 | 0.000 | 0.945 | 0.000 | 0.000 | 0.000 | 0.000 | ||
| 3 spectra, AVECLLDSK | 0.000 | 0.000 | 0.000 | 0.953 | 0.000 | 0.000 | 0.000 | 0.047 | ||
| 4 spectra, ESVVDYCNR | 0.007 | 0.000 | 0.000 | 0.910 | 0.000 | 0.000 | 0.000 | 0.083 | ||
| 2 spectra, GEEALFTTR | 0.000 | 0.000 | 0.000 | 0.975 | 0.000 | 0.000 | 0.025 | 0.000 |
| Plot | Mito | Lyso or Perox | ER | Golgi | PM | Cytosol | Nucleus | ||||||
| Expt B |
3 peptides |
9 spectra |
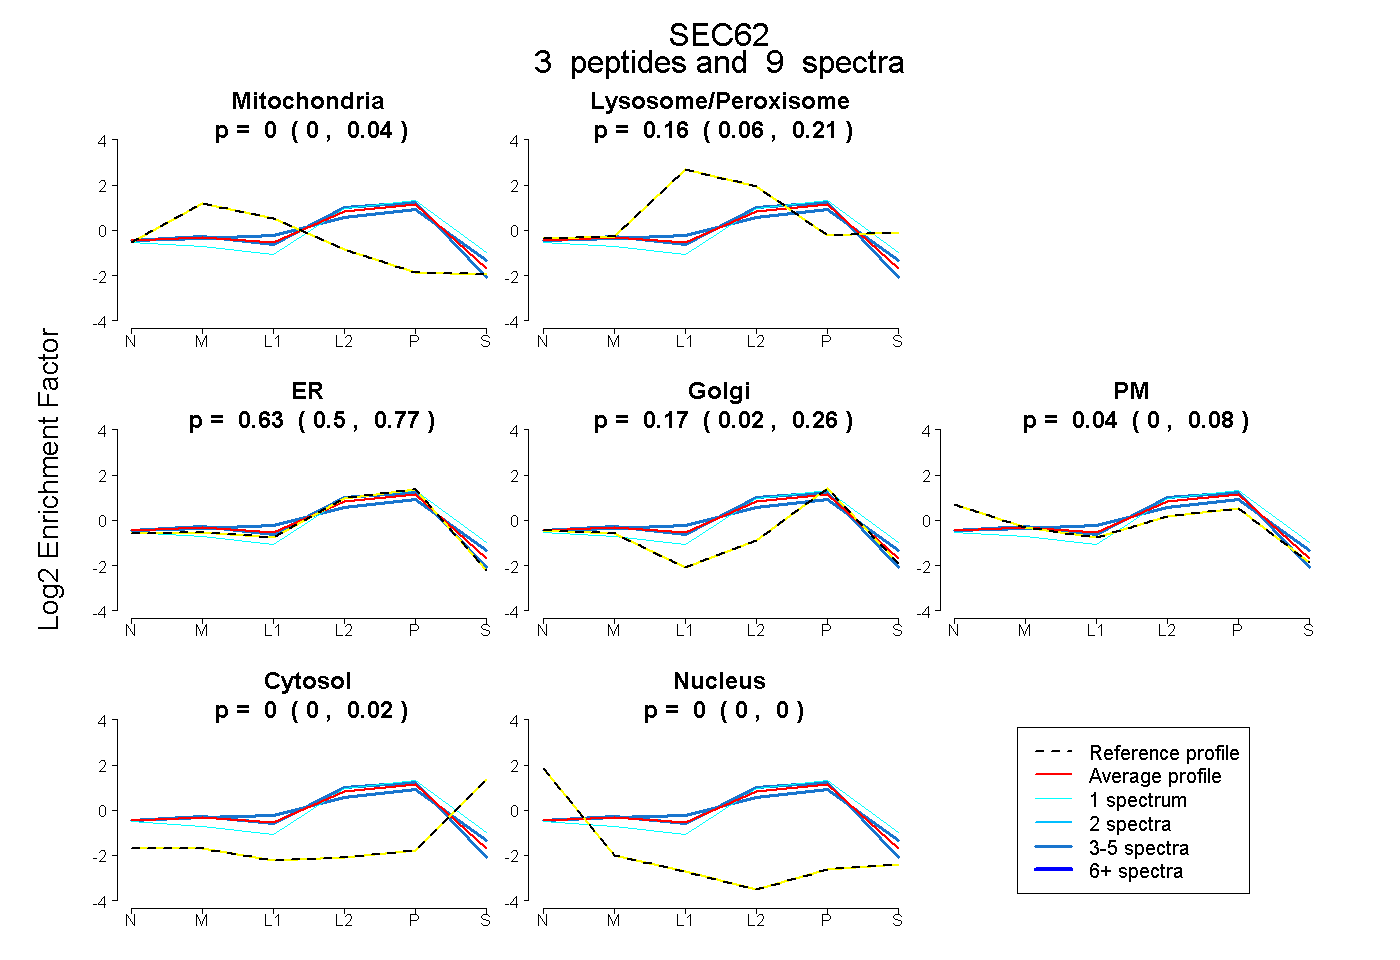 |
0.000 0.000 | 0.038 |
0.156 0.065 | 0.210 |
0.626 0.498 | 0.766 |
0.174 0.020 | 0.262 |
0.043 0.000 | 0.084 |
0.000 0.000 | 0.024 |
0.000 0.000 | 0.000 |
|||
| Plot | Lyso | Other | |||||||||||
| Expt C |
9 peptides |
40 spectra |
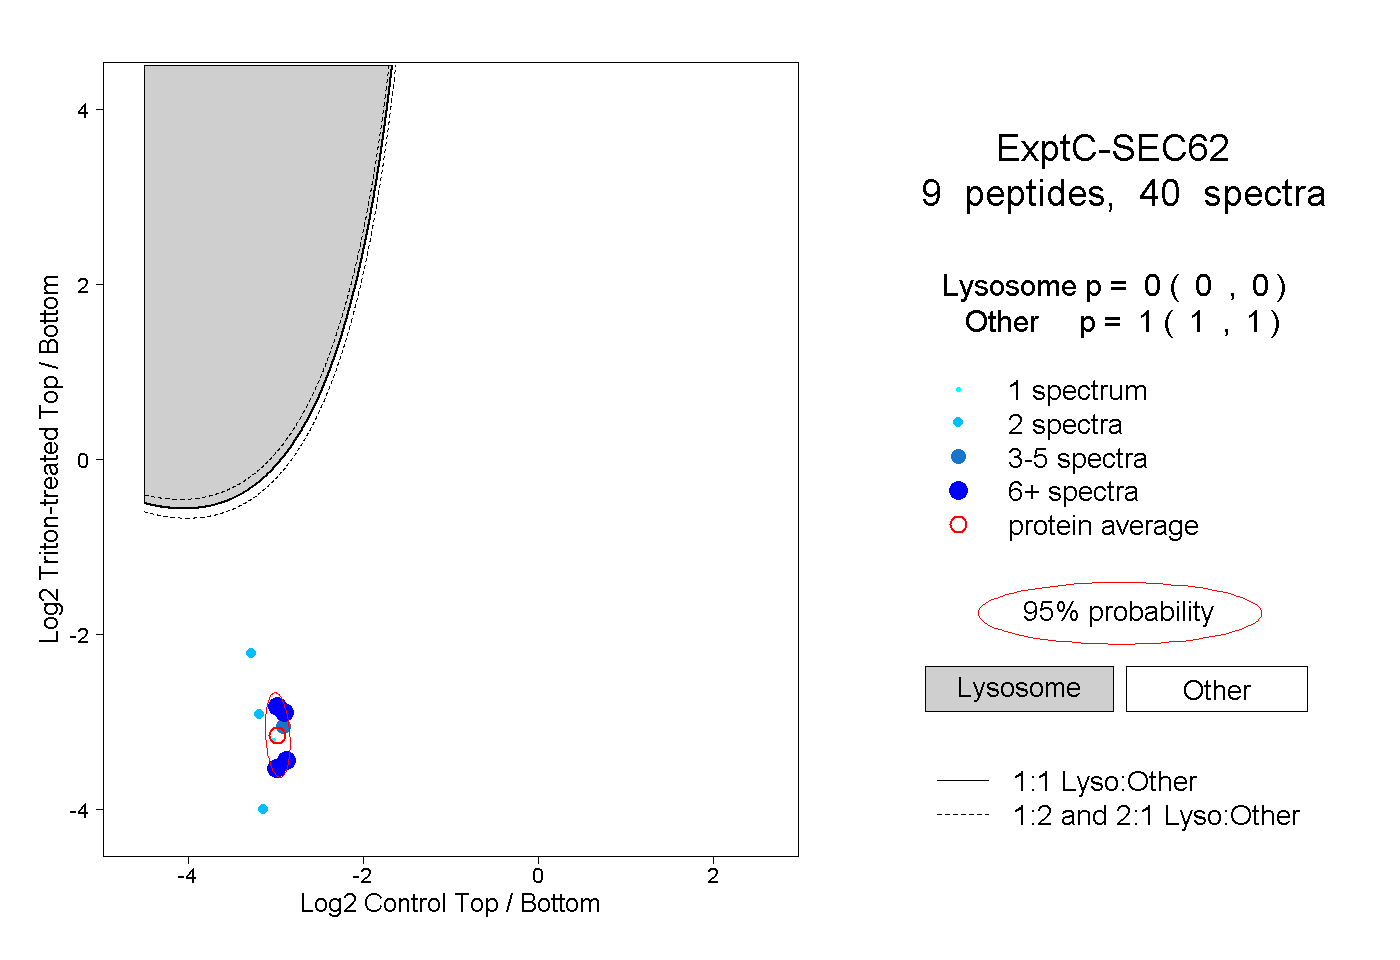 |
0.000 0.000 | 0.000 |
1.000 1.000 | 1.000 |
||||||||
| Plot | Lyso | Other | |||||||||||
| Expt D |
3 peptides |
5 spectra |
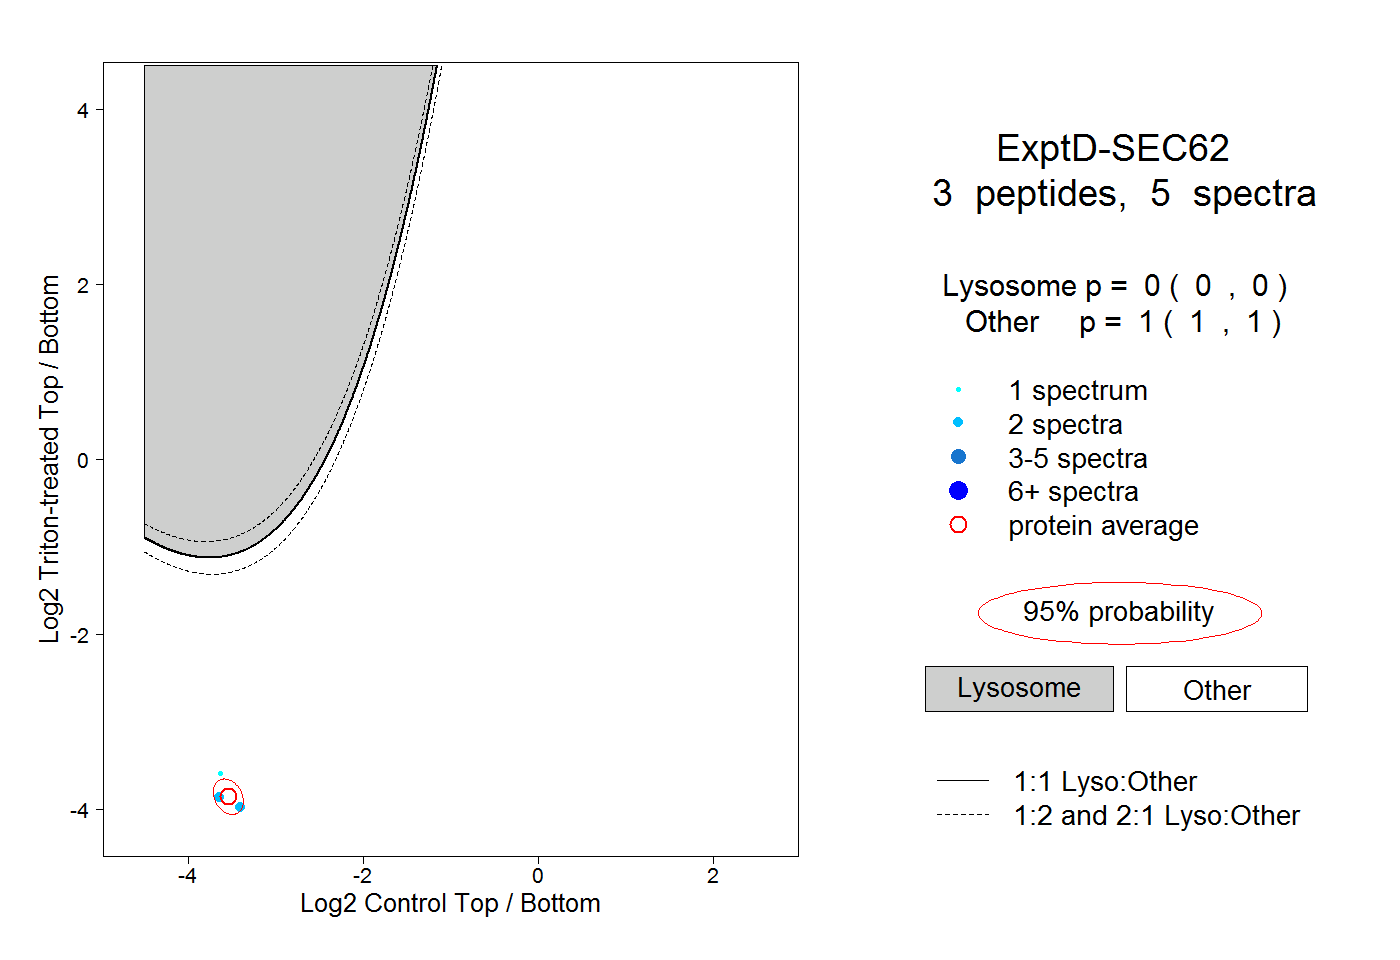 |
0.000 0.000 | 0.000 |
1.000 1.000 | 1.000 |