 10
10peptides
spectra
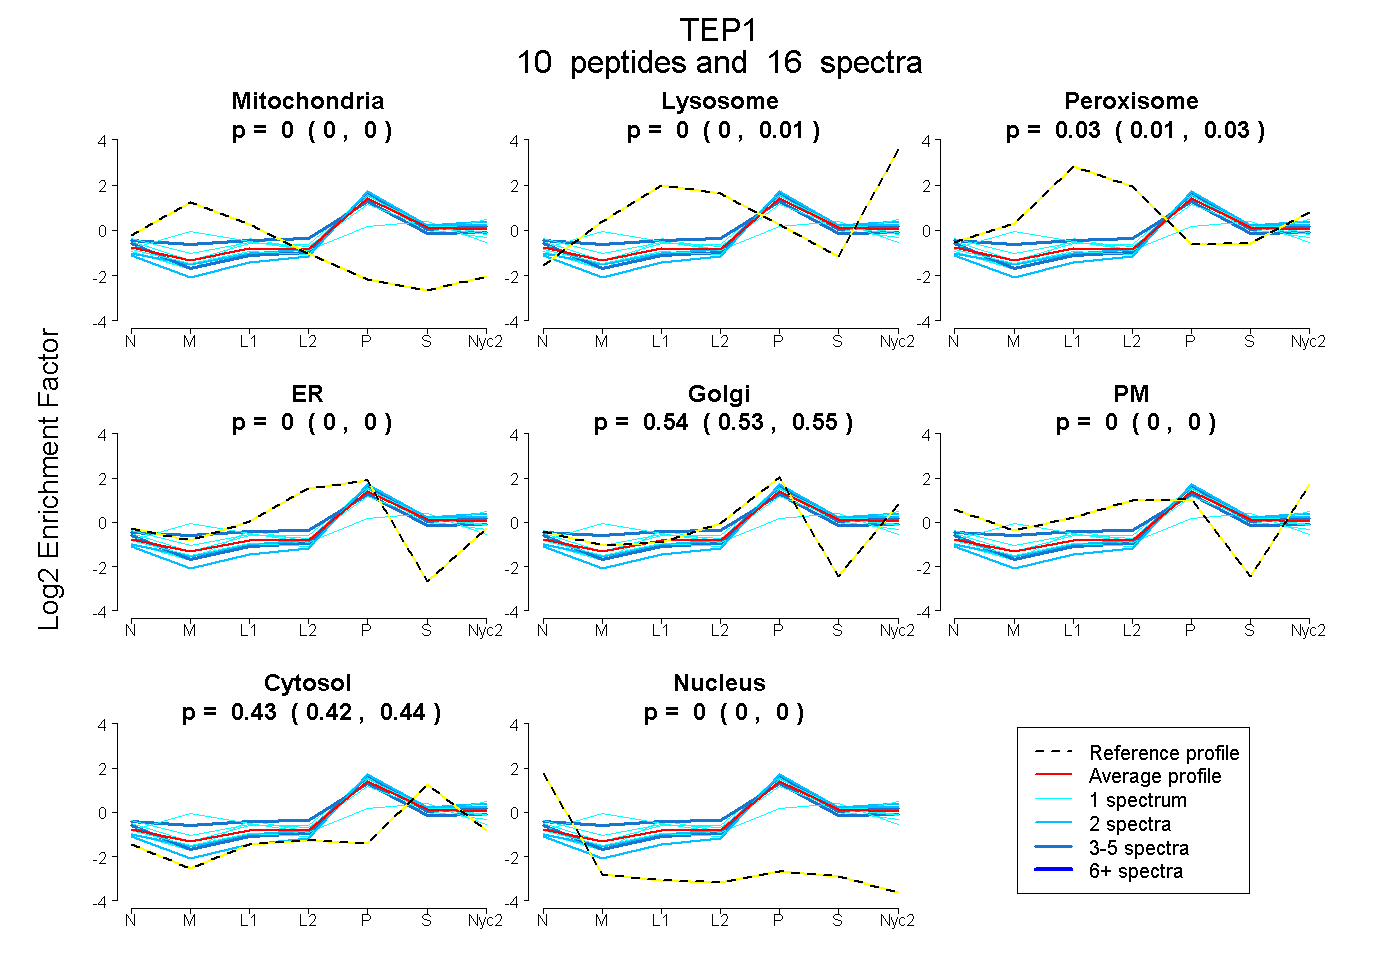
0.000 | 0.000
0.000 | 0.006
0.012 | 0.035
0.000 | 0.000
0.530 | 0.553
0.000 | 0.000
0.421 | 0.440
0.000 | 0.000
2peptides
spectra
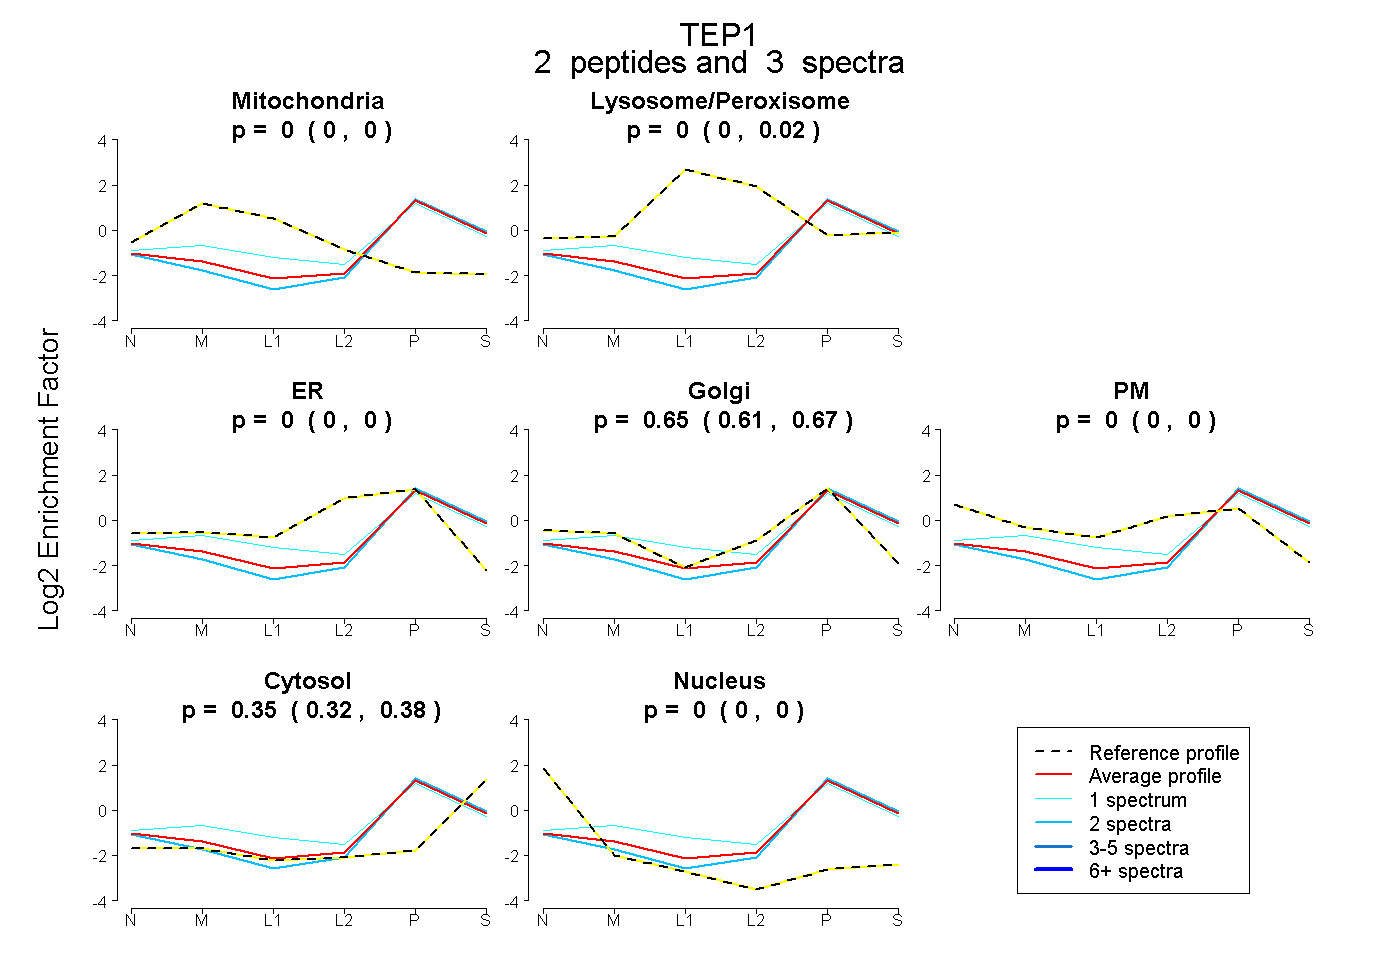
0.000 | 0.000
0.000 | 0.019
0.000 | 0.000
0.612 | 0.671
0.000 | 0.000
0.321 | 0.380
0.000 | 0.000
4peptides
spectra
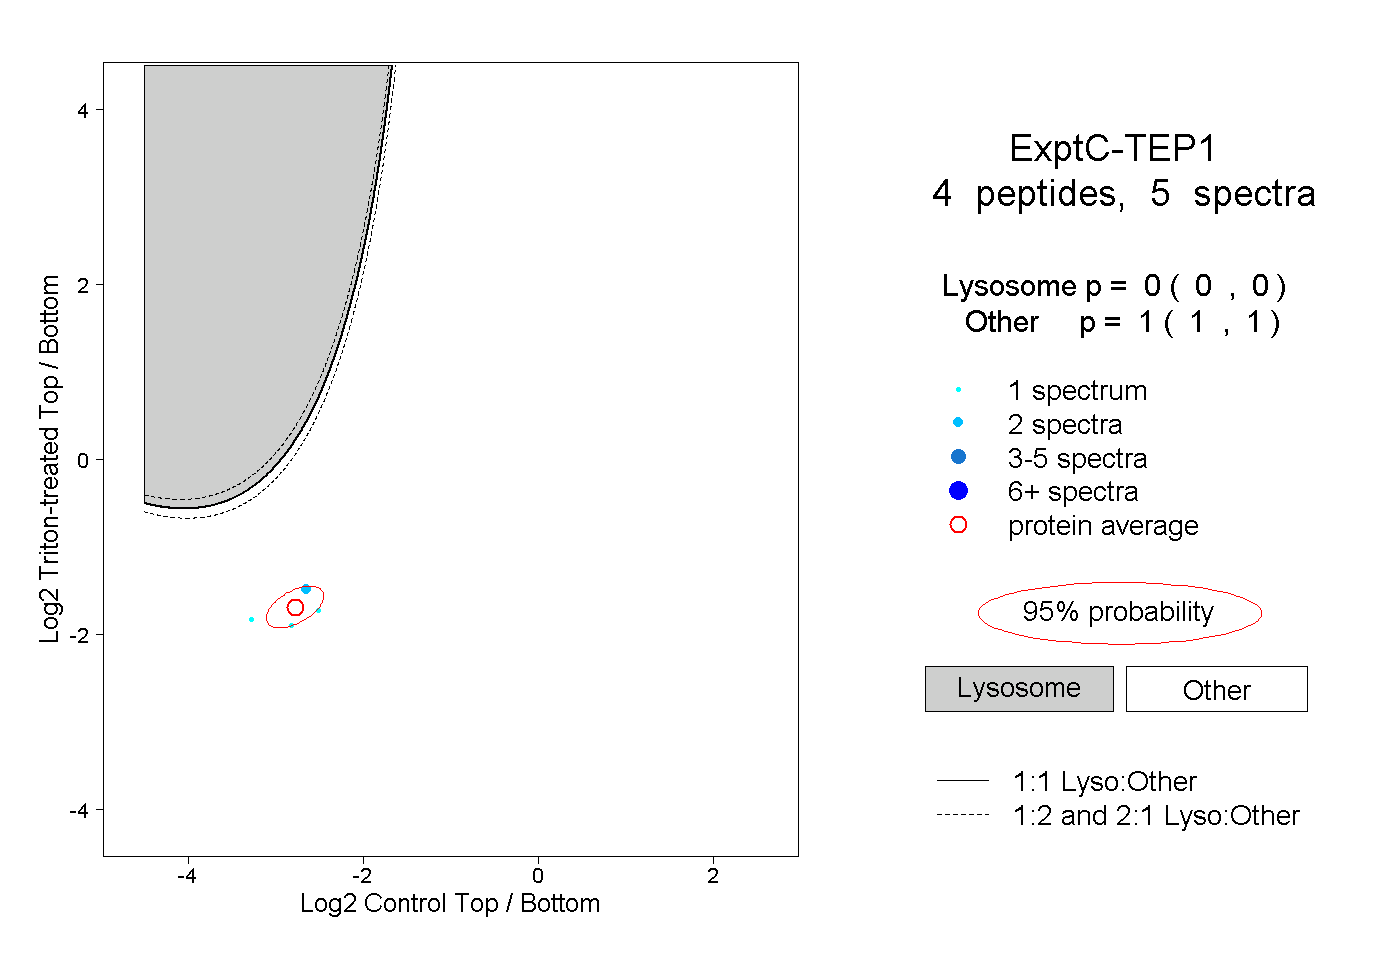
0.000 | 0.000
1.000 | 1.000
2peptides
spectra
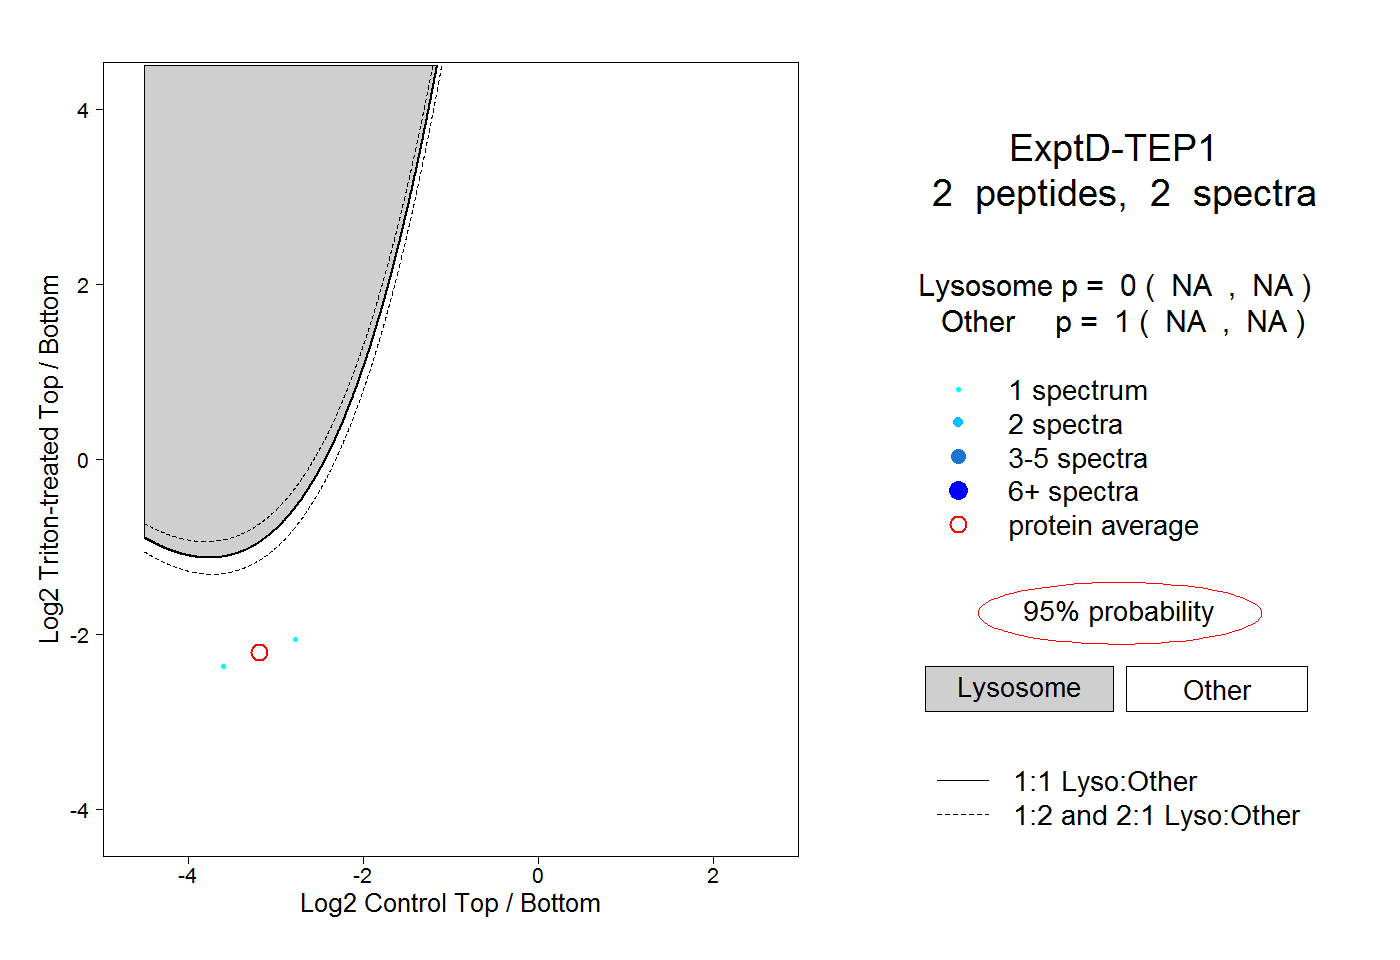
NA | NA
NA | NA