 10
10peptides
spectra
0.000 | 0.000
0.000 | 0.006
0.012 | 0.035
0.000 | 0.000
0.530 | 0.553
0.000 | 0.000
0.421 | 0.440
0.000 | 0.000
| Plot | Mito | Lyso | Perox | ER | Golgi | PM | Cytosol | Nucleus | |||||
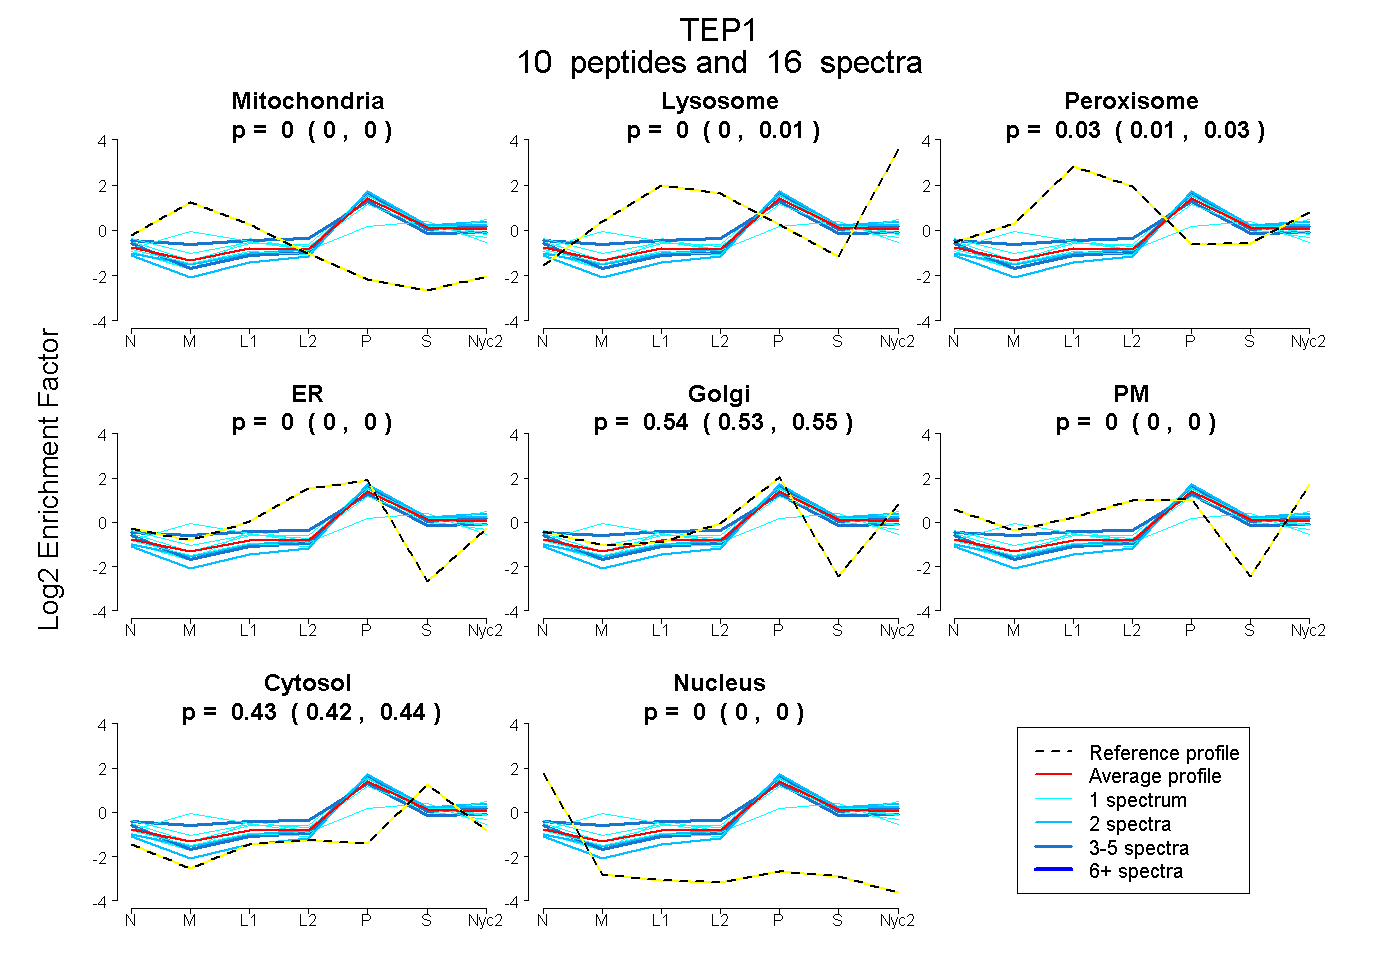
| Expt A |
10 peptides |
16 spectra |
|
0.000 0.000 | 0.000 |
0.000 0.000 | 0.006 |
0.026 0.012 | 0.035 |
0.000 0.000 | 0.000 |
0.543 0.530 | 0.553 |
0.000 0.000 | 0.000 |
0.431 0.421 | 0.440 |
0.000 0.000 | 0.000 |
| 1 spectrum, SVNPDILSLENR | 0.000 | 0.000 | 0.000 | 0.000 | 0.532 | 0.000 | 0.468 | 0.000 | ||
| 1 spectrum, TVSSGPLLQCLHR | 0.155 | 0.000 | 0.151 | 0.000 | 0.242 | 0.000 | 0.451 | 0.000 | ||
| 3 spectra, LFISSTFR | 0.000 | 0.000 | 0.000 | 0.000 | 0.581 | 0.000 | 0.419 | 0.000 | ||
| 2 spectra, ILATAGR | 0.000 | 0.027 | 0.000 | 0.000 | 0.543 | 0.000 | 0.430 | 0.000 | ||
| 2 spectra, VILFGQR | 0.000 | 0.000 | 0.000 | 0.000 | 0.526 | 0.000 | 0.474 | 0.000 | ||
| 3 spectra, SPPSPARPR | 0.000 | 0.000 | 0.165 | 0.000 | 0.523 | 0.000 | 0.312 | 0.000 | ||
| 1 spectrum, ELDLPTGPR | 0.000 | 0.016 | 0.037 | 0.000 | 0.514 | 0.000 | 0.432 | 0.000 | ||
| 1 spectrum, QLLTQPHAVEELPCAAELR | 0.000 | 0.060 | 0.016 | 0.000 | 0.575 | 0.000 | 0.349 | 0.000 | ||
| 1 spectrum, SVWPLK | 0.000 | 0.000 | 0.106 | 0.000 | 0.481 | 0.000 | 0.412 | 0.000 | ||
| 1 spectrum, EADDTCKPR | 0.000 | 0.000 | 0.000 | 0.000 | 0.561 | 0.000 | 0.439 | 0.000 |
| Plot | Mito | Lyso or Perox | ER | Golgi | PM | Cytosol | Nucleus | ||||||
| Expt B |
2 peptides |
3 spectra |
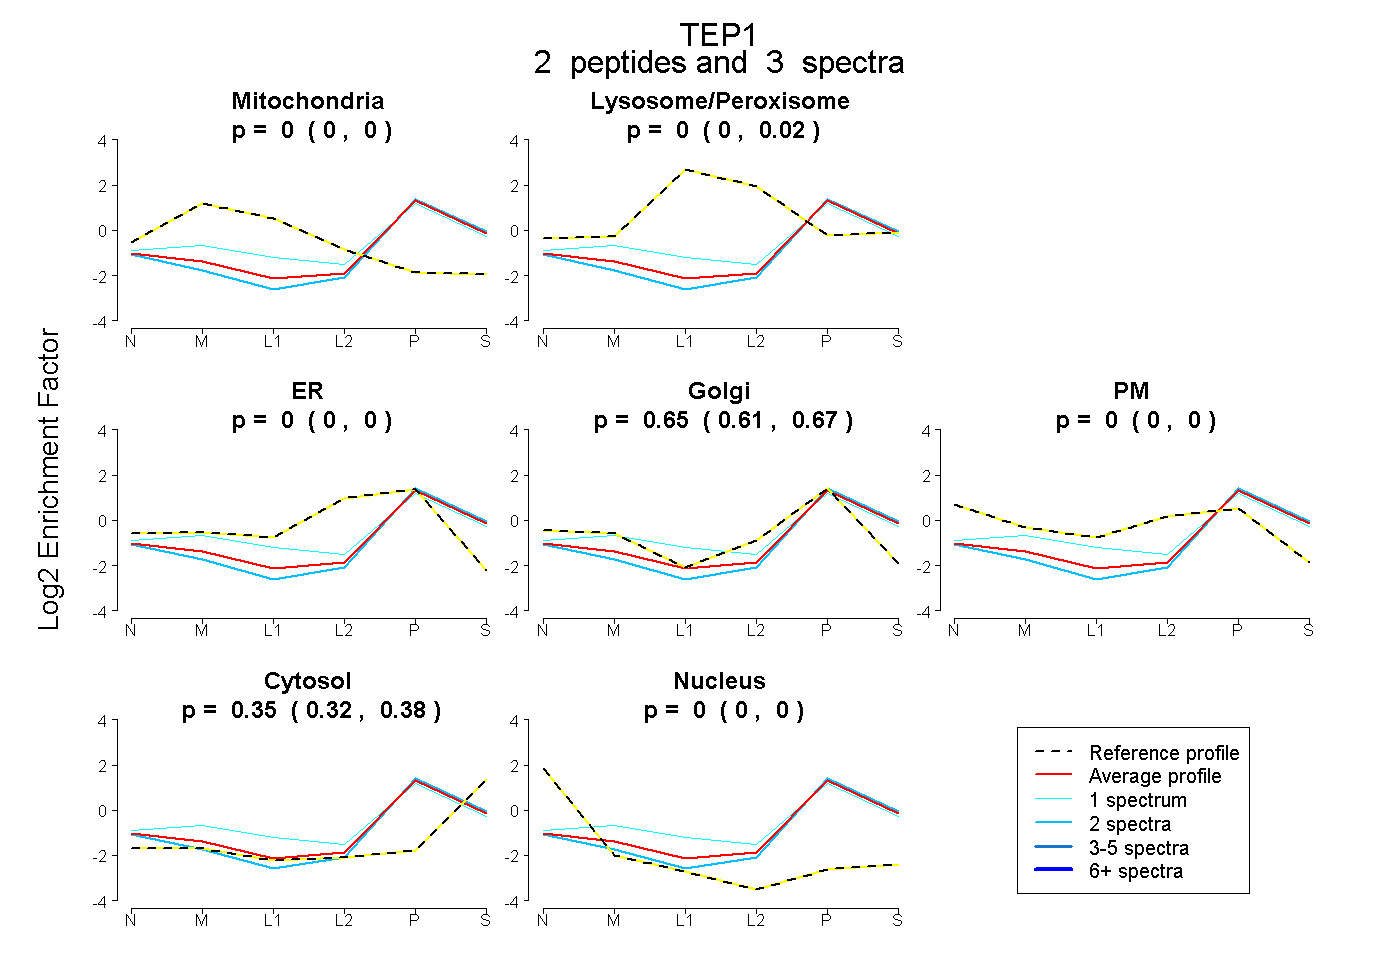 |
0.000 0.000 | 0.000 |
0.000 0.000 | 0.019 |
0.000 0.000 | 0.000 |
0.646 0.612 | 0.671 |
0.000 0.000 | 0.000 |
0.354 0.321 | 0.380 |
0.000 0.000 | 0.000 |
|||
| Plot | Lyso | Other | |||||||||||
| Expt C |
4 peptides |
5 spectra |
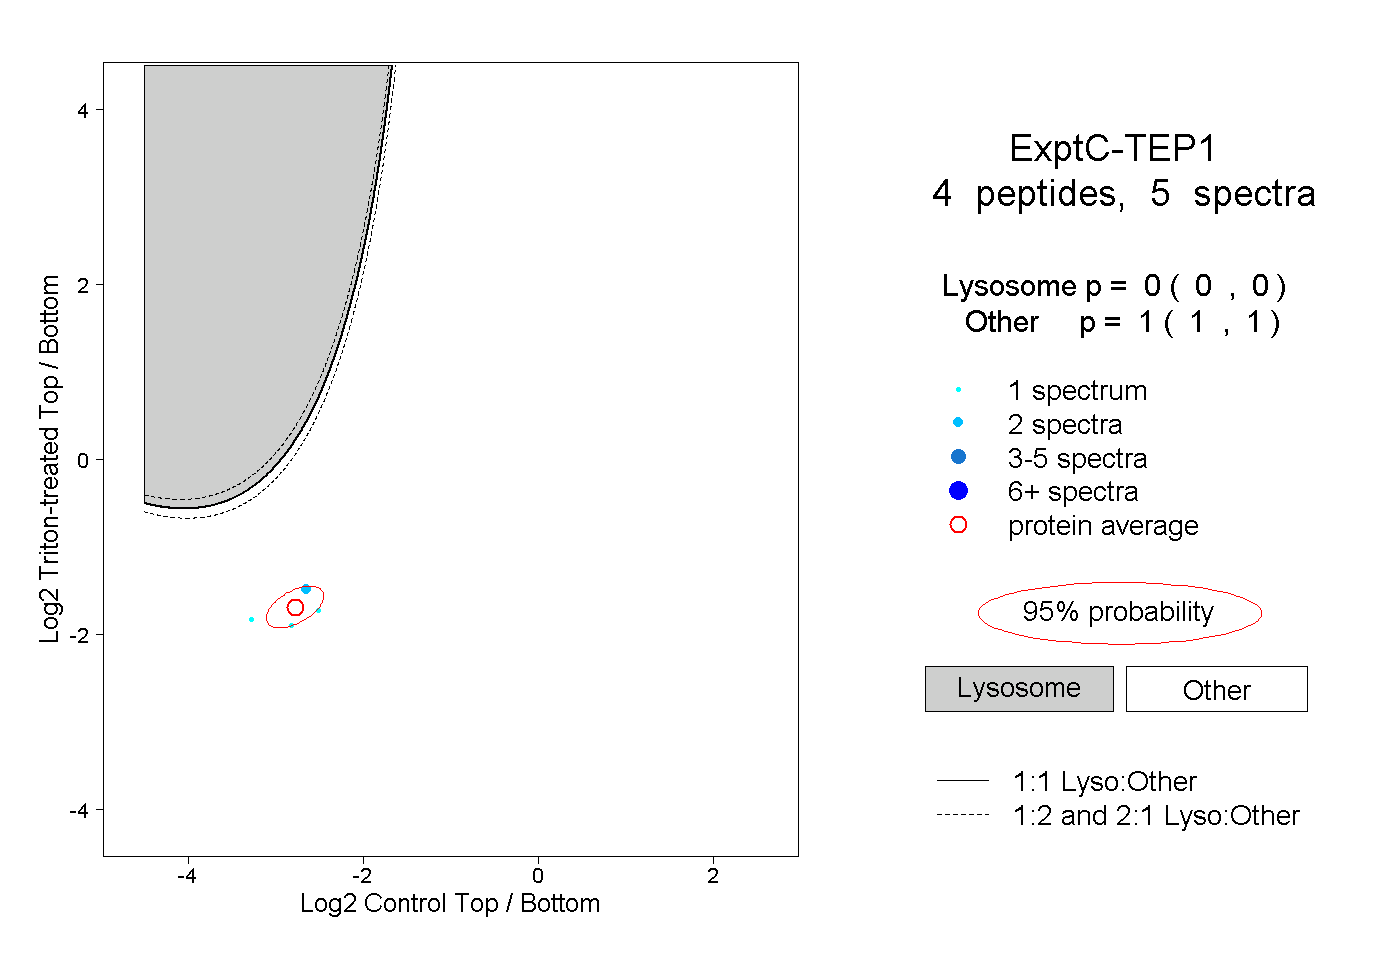 |
0.000 0.000 | 0.000 |
1.000 1.000 | 1.000 |
||||||||
| Plot | Lyso | Other | |||||||||||
| Expt D |
2 peptides |
2 spectra |
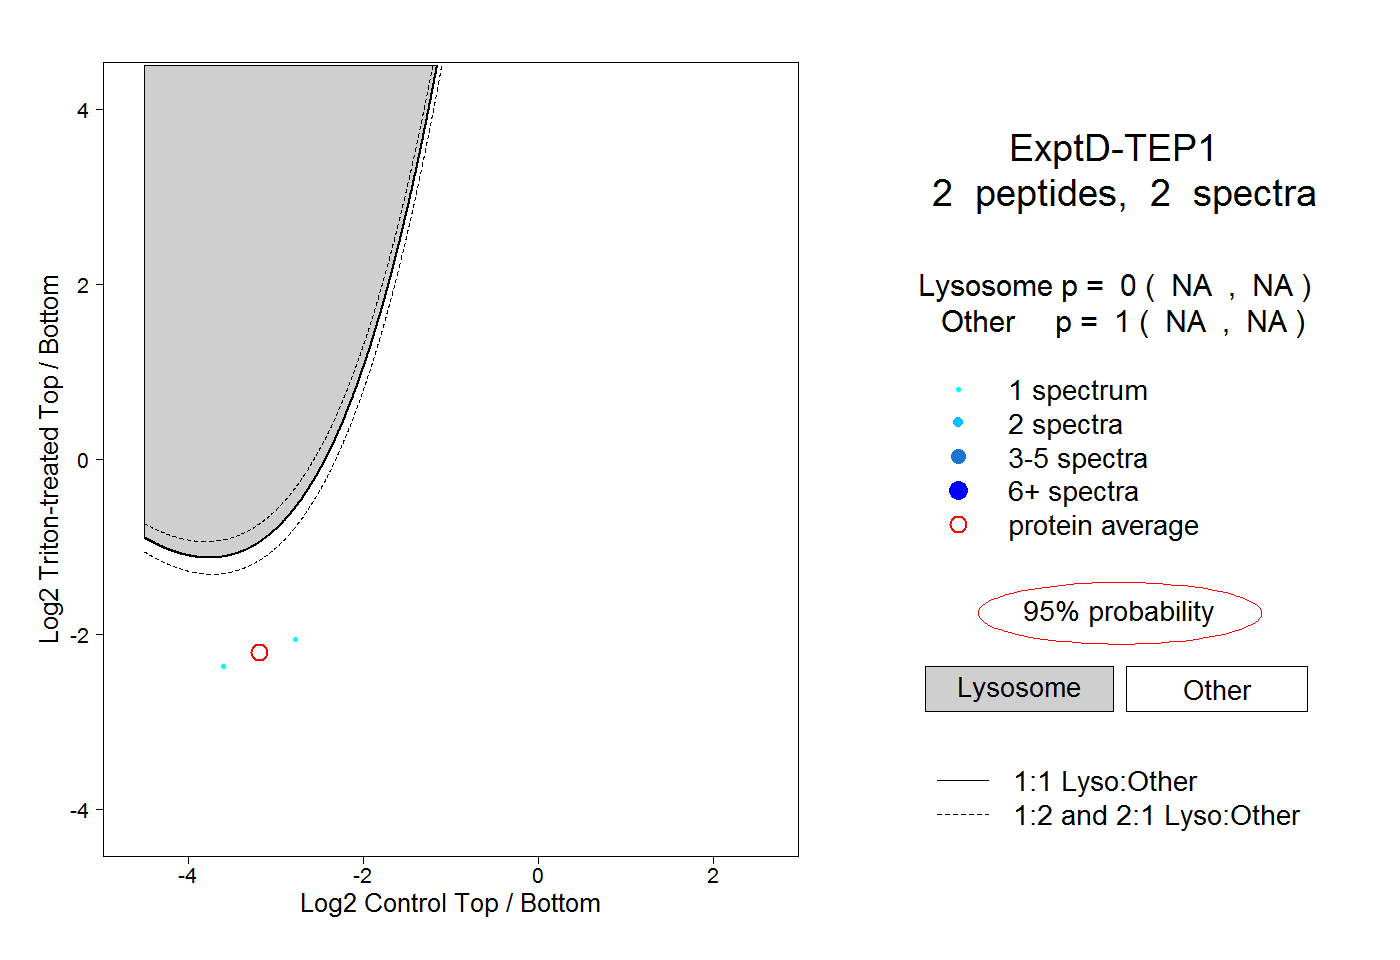 |
0.000 NA | NA |
1.000 NA | NA |