 16
16peptides
spectra
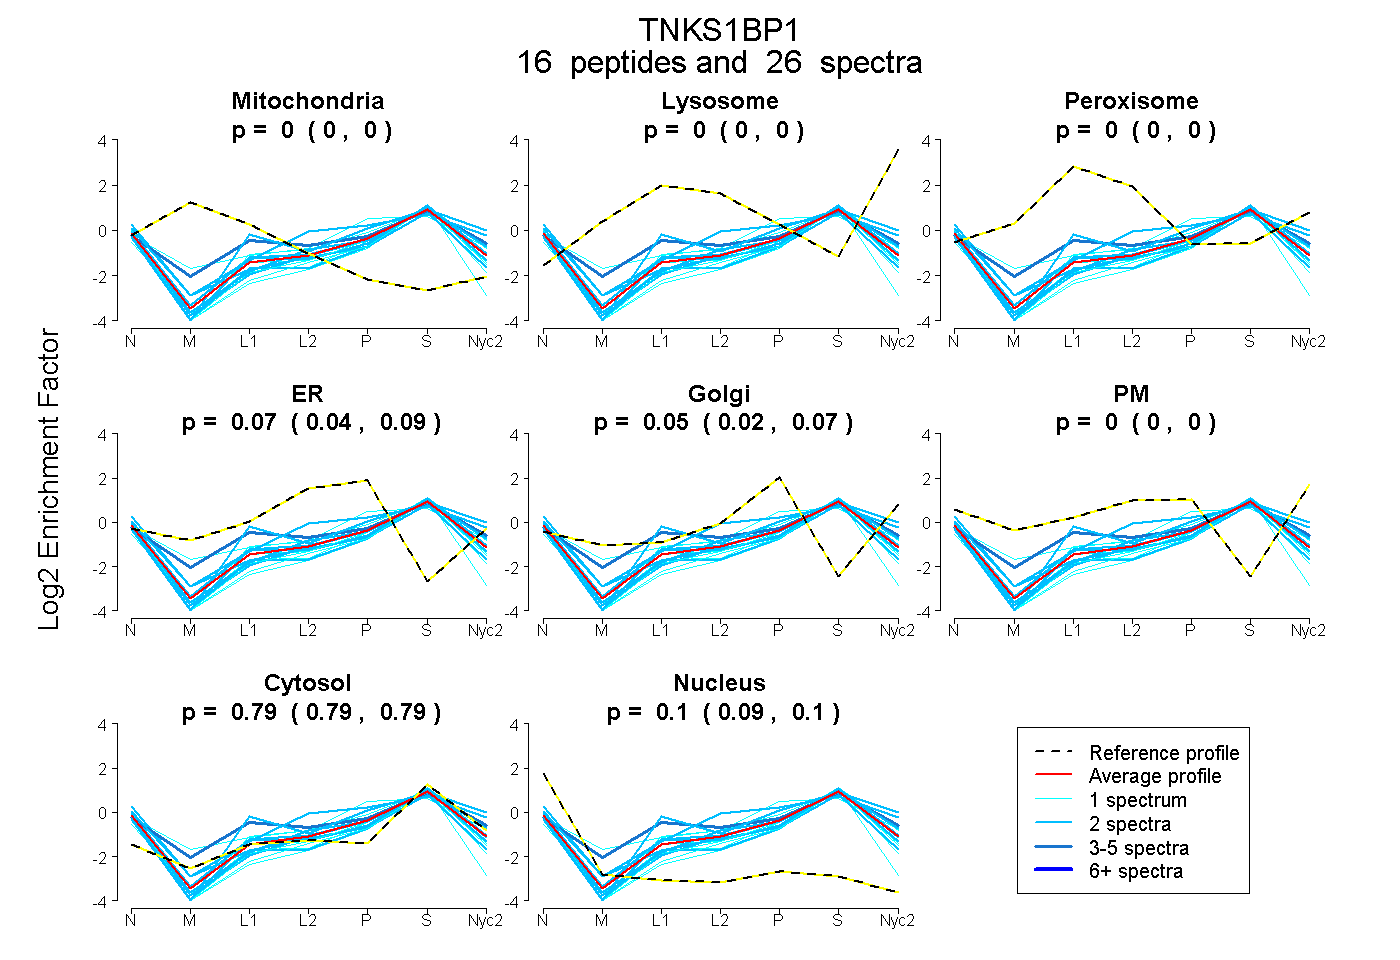
0.000 | 0.000
0.000 | 0.000
0.000 | 0.000
0.041 | 0.087
0.019 | 0.070
0.000 | 0.000
0.786 | 0.795
0.090 | 0.102
3peptides
spectra
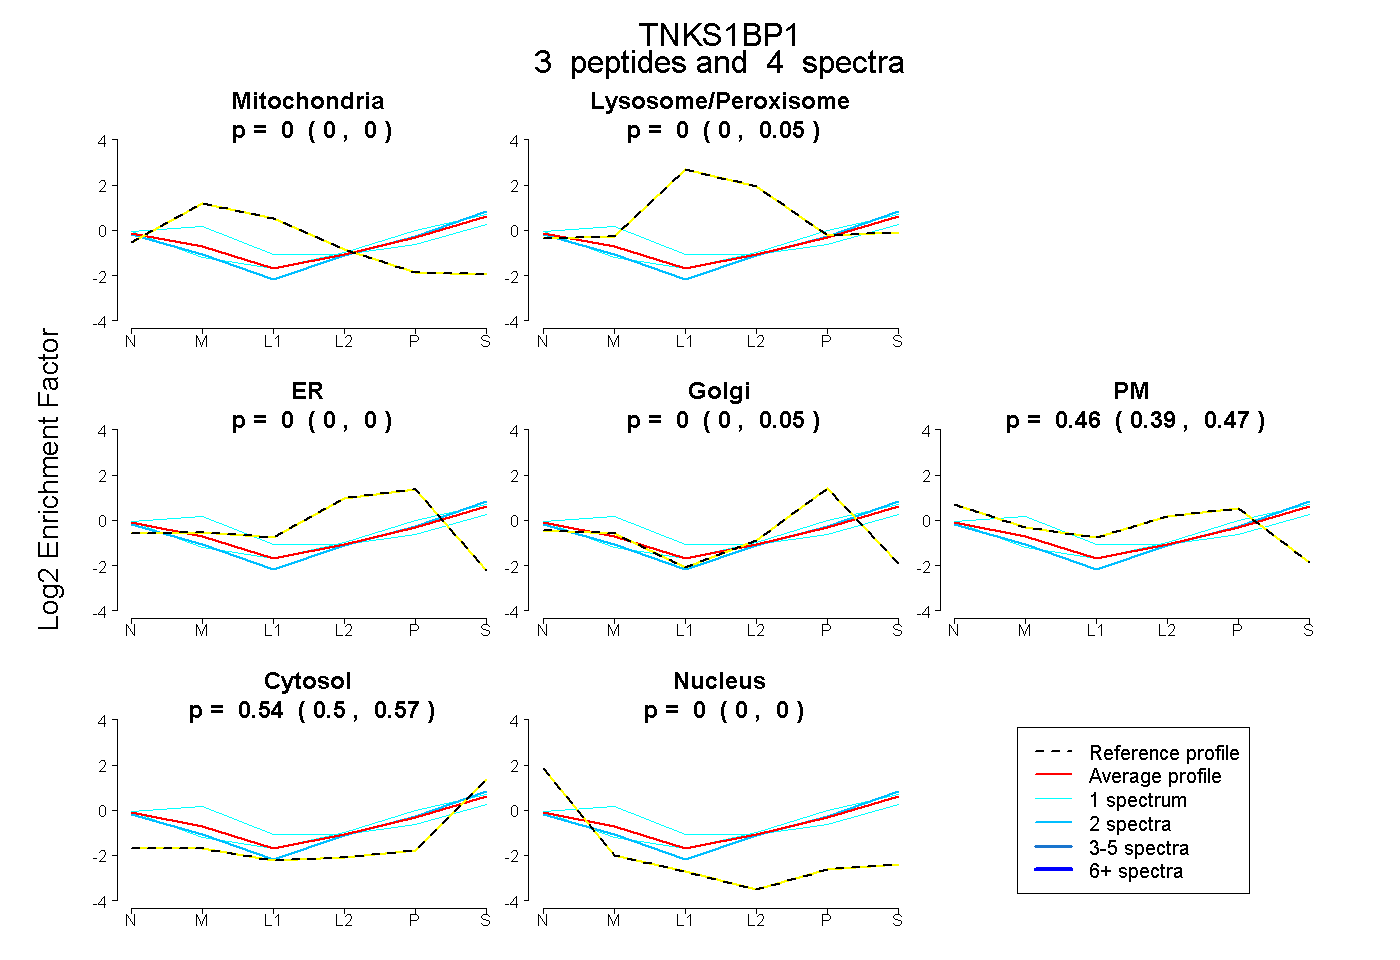
0.000 | 0.000
0.000 | 0.050
0.000 | 0.000
0.000 | 0.050
0.387 | 0.473
0.501 | 0.566
0.000 | 0.000
7peptides
spectra
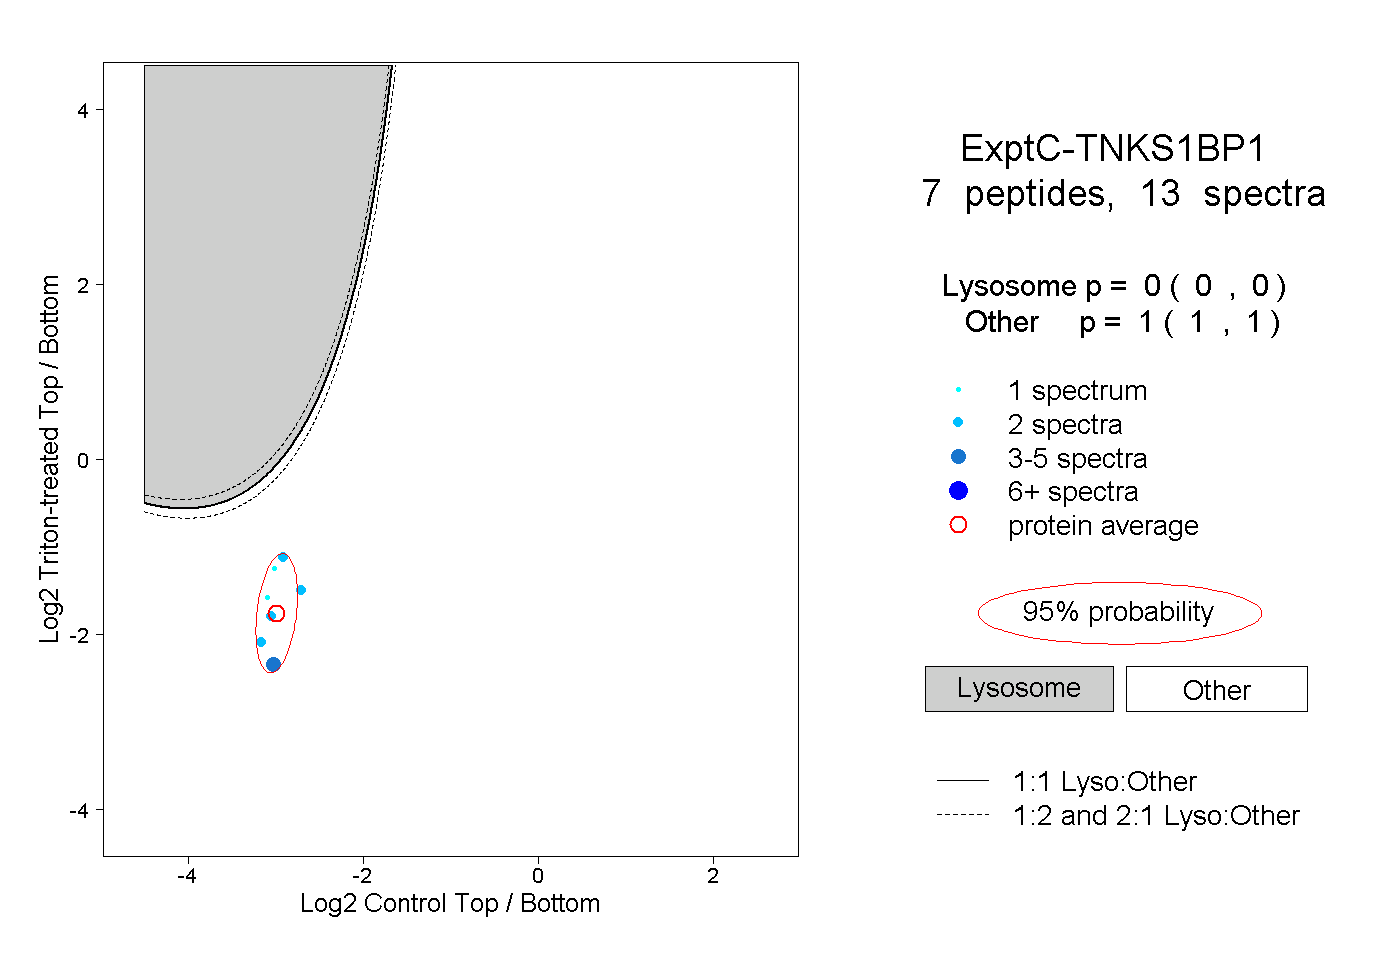
0.000 | 0.000
1.000 | 1.000