 16
16peptides
spectra
0.000 | 0.000
0.000 | 0.000
0.000 | 0.000
0.041 | 0.087
0.019 | 0.070
0.000 | 0.000
0.786 | 0.795
0.090 | 0.102
| Plot | Mito | Lyso | Perox | ER | Golgi | PM | Cytosol | Nucleus | |||||
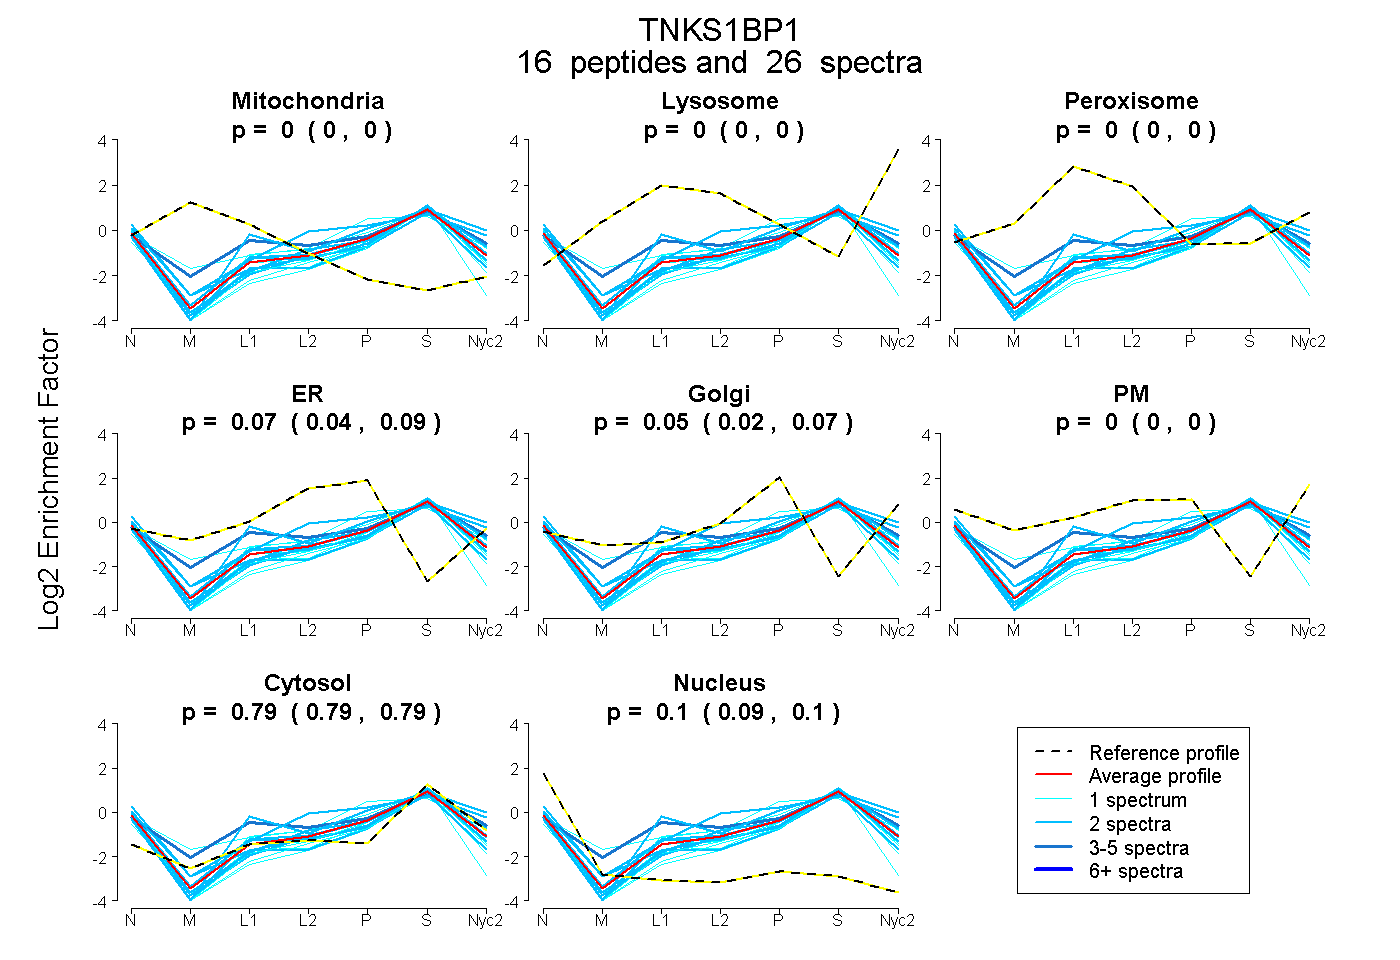
| Expt A |
16 peptides |
26 spectra |
|
0.000 0.000 | 0.000 |
0.000 0.000 | 0.000 |
0.000 0.000 | 0.000 |
0.066 0.041 | 0.087 |
0.047 0.019 | 0.070 |
0.000 0.000 | 0.000 |
0.791 0.786 | 0.795 |
0.096 0.090 | 0.102 |
| 1 spectrum, SSGSLSPGLETEDPLEAR | 0.000 | 0.000 | 0.000 | 0.000 | 0.056 | 0.000 | 0.802 | 0.142 | ||
| 1 spectrum, DLPGQGEVGGHSQAR | 0.000 | 0.000 | 0.000 | 0.010 | 0.000 | 0.000 | 0.798 | 0.192 | ||
| 2 spectra, ALSSQER | 0.000 | 0.000 | 0.000 | 0.111 | 0.016 | 0.000 | 0.787 | 0.087 | ||
| 2 spectra, VGPDLELDPK | 0.000 | 0.000 | 0.000 | 0.000 | 0.075 | 0.153 | 0.772 | 0.000 | ||
| 1 spectrum, NLEVSSCVSSDGSSEAR | 0.000 | 0.000 | 0.000 | 0.000 | 0.000 | 0.000 | 0.803 | 0.197 | ||
| 2 spectra, TFPCGEEAAAR | 0.000 | 0.000 | 0.000 | 0.142 | 0.053 | 0.123 | 0.681 | 0.000 | ||
| 1 spectrum, AIAQQDQEFGK | 0.000 | 0.000 | 0.000 | 0.133 | 0.227 | 0.000 | 0.639 | 0.001 | ||
| 2 spectra, NLEVSCDLESGGSR | 0.000 | 0.000 | 0.000 | 0.086 | 0.000 | 0.000 | 0.713 | 0.200 | ||
| 2 spectra, GVGQADWTPDLGLR | 0.000 | 0.000 | 0.000 | 0.041 | 0.000 | 0.000 | 0.871 | 0.088 | ||
| 3 spectra, SPGGDPGLGK | 0.000 | 0.000 | 0.098 | 0.078 | 0.000 | 0.111 | 0.706 | 0.006 | ||
| 2 spectra, VSGAGLSPSR | 0.000 | 0.000 | 0.000 | 0.000 | 0.125 | 0.000 | 0.803 | 0.072 | ||
| 1 spectrum, EEGNWQDGAPSQEITR | 0.000 | 0.000 | 0.000 | 0.000 | 0.000 | 0.000 | 0.714 | 0.286 | ||
| 1 spectrum, APAIRPGGTLGLSETADMDAR | 0.000 | 0.000 | 0.000 | 0.000 | 0.091 | 0.000 | 0.865 | 0.044 | ||
| 1 spectrum, DYSDSSLR | 0.000 | 0.000 | 0.000 | 0.133 | 0.000 | 0.000 | 0.781 | 0.086 | ||
| 2 spectra, LFQDSTEPR | 0.000 | 0.000 | 0.000 | 0.017 | 0.045 | 0.000 | 0.802 | 0.136 | ||
| 2 spectra, GCGVGQMDWAQDLGLR | 0.000 | 0.000 | 0.000 | 0.000 | 0.012 | 0.000 | 0.852 | 0.136 |
| Plot | Mito | Lyso or Perox | ER | Golgi | PM | Cytosol | Nucleus | ||||||
| Expt B |
3 peptides |
4 spectra |
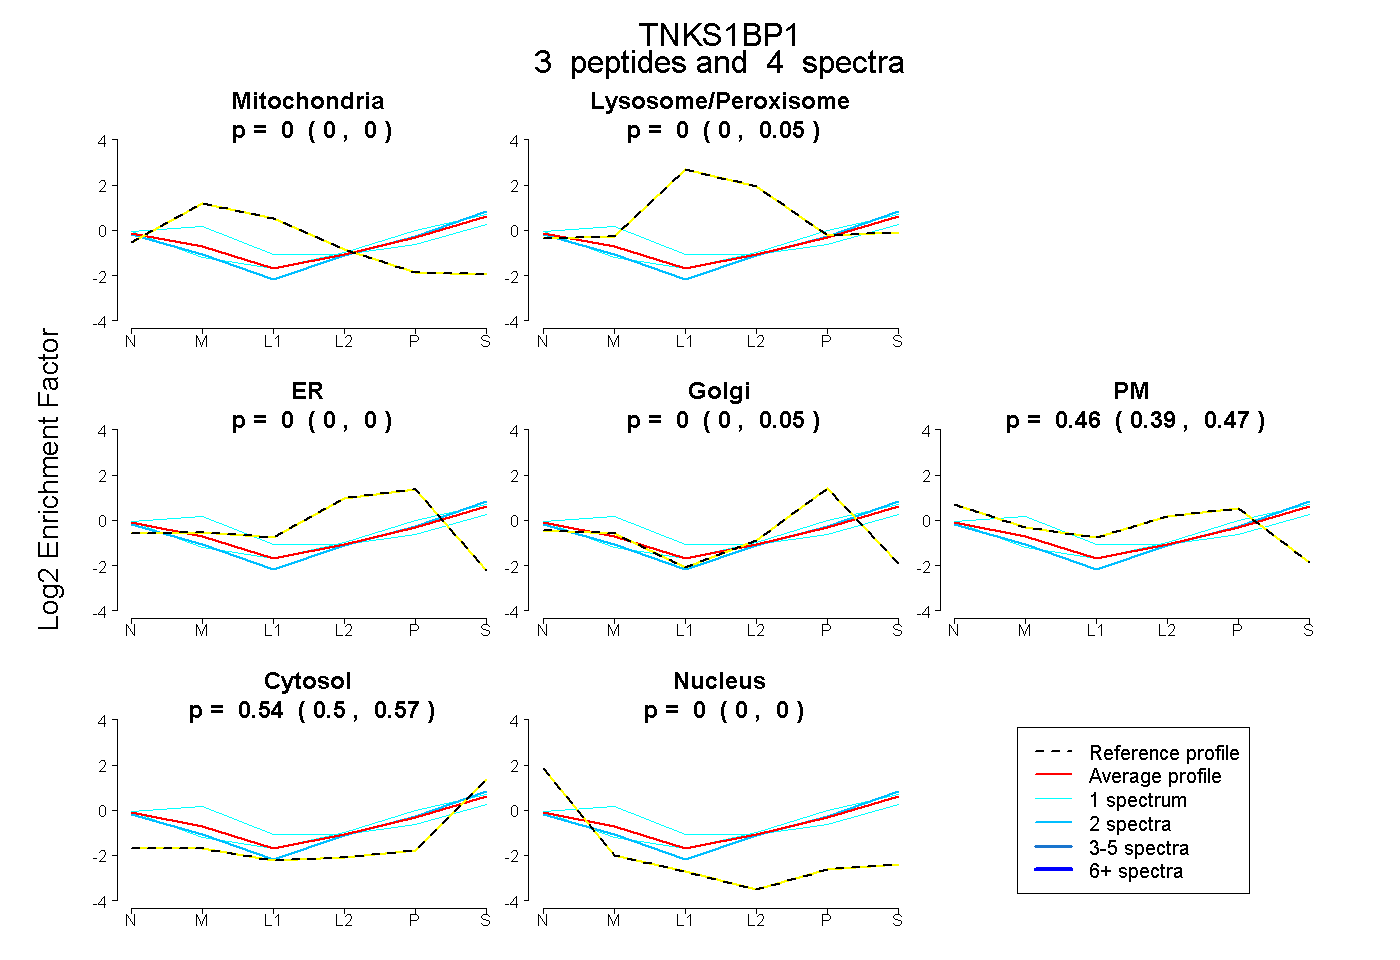 |
0.000 0.000 | 0.000 |
0.003 0.000 | 0.050 |
0.000 0.000 | 0.000 |
0.000 0.000 | 0.050 |
0.458 0.387 | 0.473 |
0.539 0.501 | 0.566 |
0.000 0.000 | 0.000 |
|||
| Plot | Lyso | Other | |||||||||||
| Expt C |
7 peptides |
13 spectra |
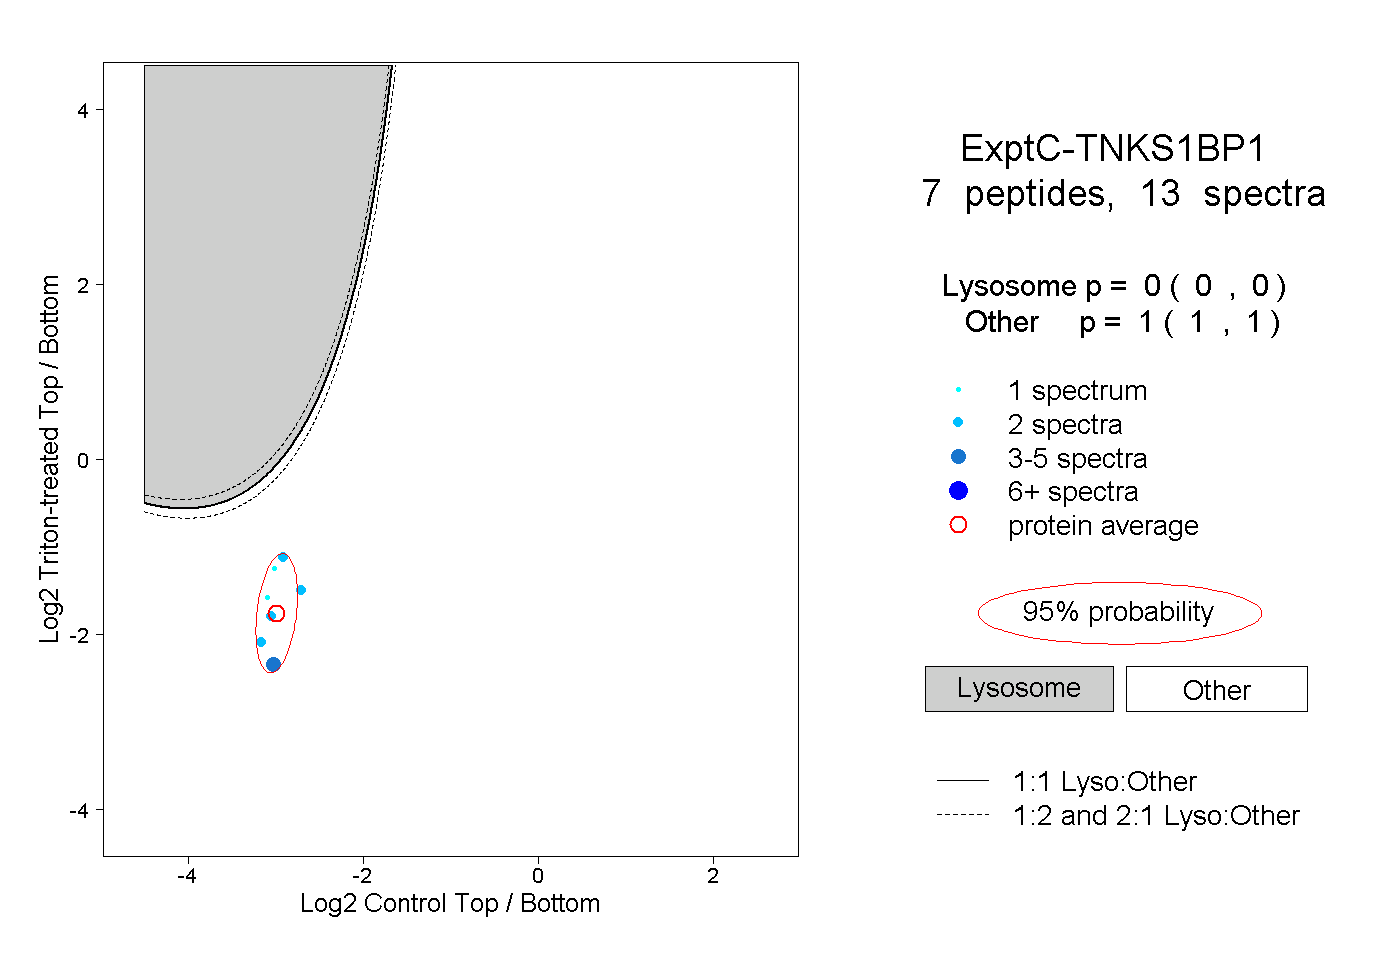 |
0.000 0.000 | 0.000 |
1.000 1.000 | 1.000 |