 5
5peptides
spectra
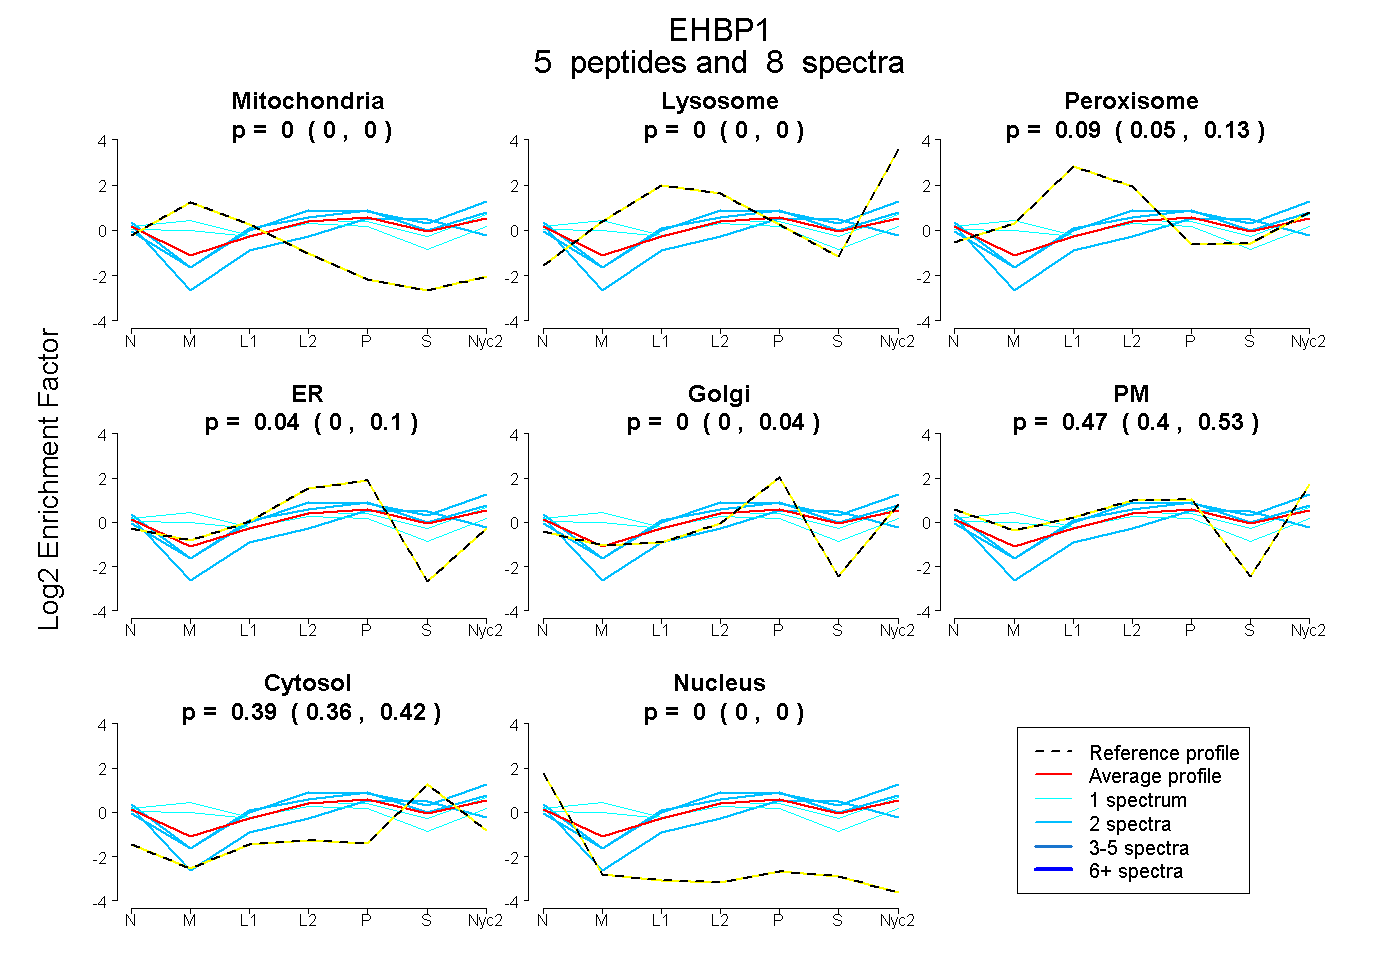
0.000 | 0.000
0.000 | 0.000
0.051 | 0.130
0.000 | 0.101
0.000 | 0.036
0.396 | 0.526
0.357 | 0.420
0.000 | 0.000
1peptide
spectrum
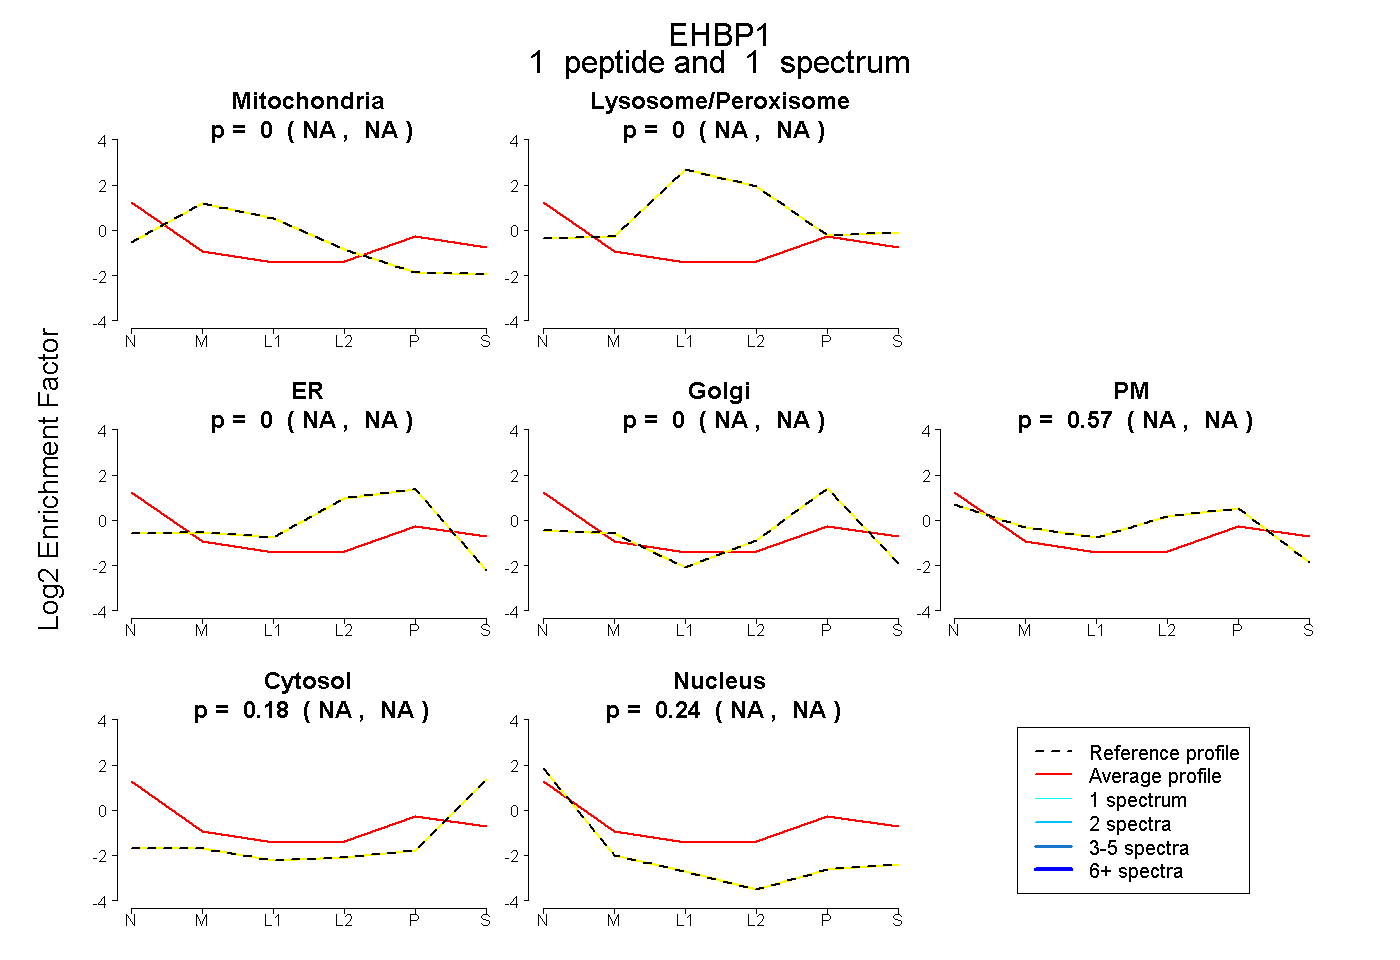
NA | NA
NA | NA
NA | NA
NA | NA
NA | NA
NA | NA
NA | NA
7peptides
spectra
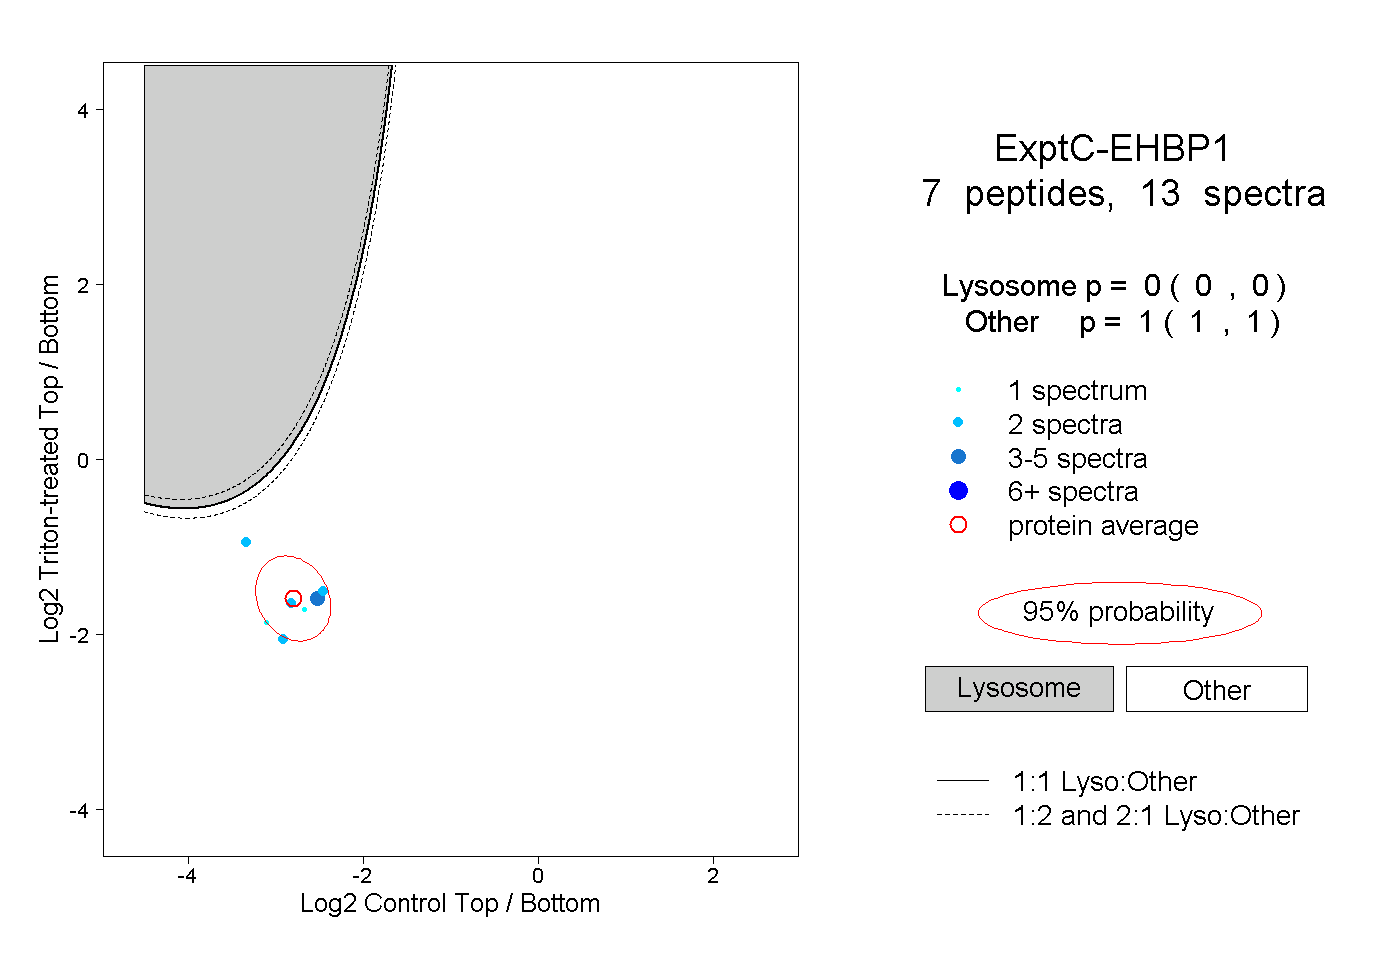
0.000 | 0.000
1.000 | 1.000
1peptide
spectrum
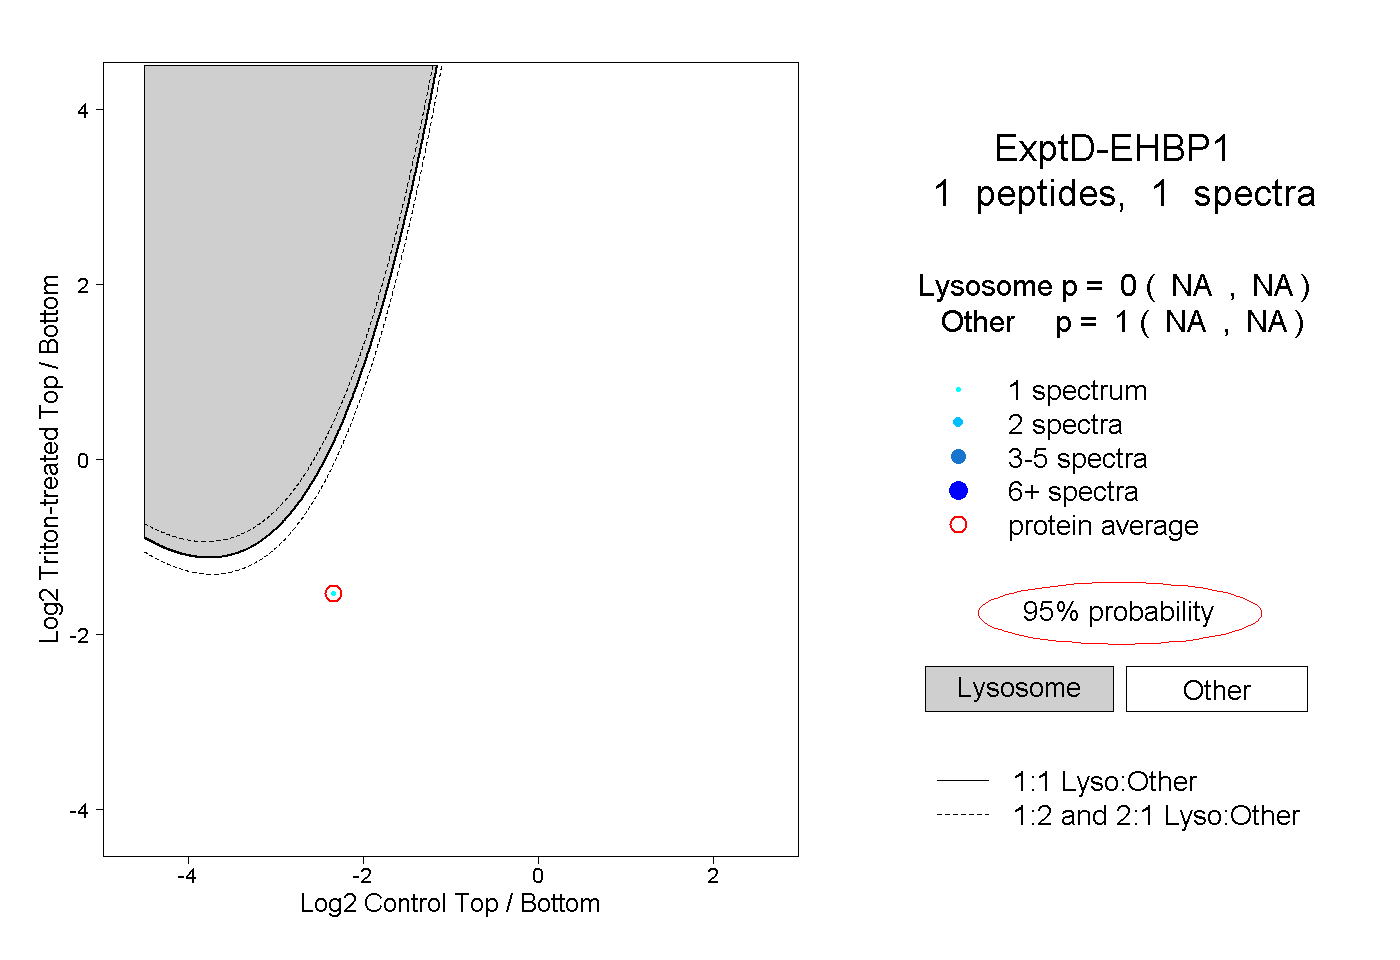
NA | NA
NA | NA