 5
5peptides
spectra
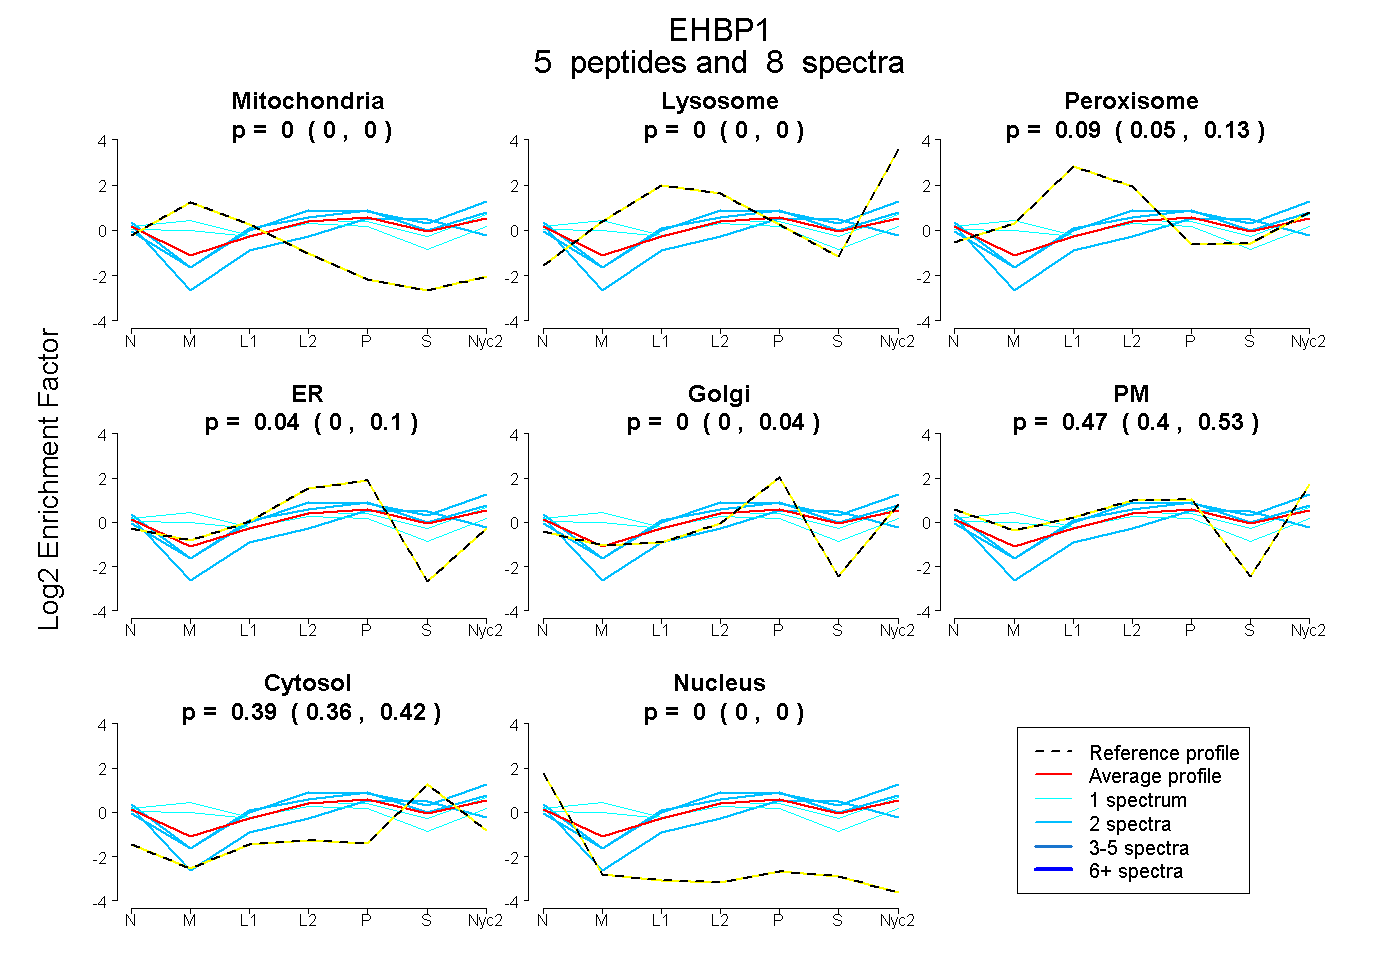
0.000 | 0.000
0.000 | 0.000
0.051 | 0.130
0.000 | 0.101
0.000 | 0.036
0.396 | 0.526
0.357 | 0.420
0.000 | 0.000
| Plot | Mito | Lyso | Perox | ER | Golgi | PM | Cytosol | Nucleus | |||||
| Expt A |
5 peptides |
8 spectra |
|
0.000 0.000 | 0.000 |
0.000 0.000 | 0.000 |
0.092 0.051 | 0.130 |
0.043 0.000 | 0.101 |
0.000 0.000 | 0.036 |
0.473 0.396 | 0.526 |
0.392 0.357 | 0.420 |
0.000 0.000 | 0.000 |
| 2 spectra, EHDLER | 0.000 | 0.206 | 0.006 | 0.065 | 0.000 | 0.343 | 0.380 | 0.000 | ||
| 1 spectrum, AHSWQPGIK | 0.005 | 0.000 | 0.171 | 0.000 | 0.000 | 0.517 | 0.307 | 0.000 | ||
| 1 spectrum, TNESTVVSAGK | 0.203 | 0.000 | 0.114 | 0.000 | 0.034 | 0.454 | 0.195 | 0.000 | ||
| 2 spectra, LQPVNPR | 0.000 | 0.000 | 0.000 | 0.144 | 0.104 | 0.142 | 0.610 | 0.000 | ||
| 2 spectra, AEDLELR | 0.000 | 0.000 | 0.105 | 0.049 | 0.000 | 0.490 | 0.356 | 0.000 |
| Plot | Mito | Lyso or Perox | ER | Golgi | PM | Cytosol | Nucleus | ||||||
| Expt B |
1 peptide |
1 spectrum |
 |
0.000 NA | NA |
0.002 NA | NA |
0.000 NA | NA |
0.000 NA | NA |
0.574 NA | NA |
0.183 NA | NA |
0.241 NA | NA |
|||
| Plot | Lyso | Other | |||||||||||
| Expt C |
7 peptides |
13 spectra |
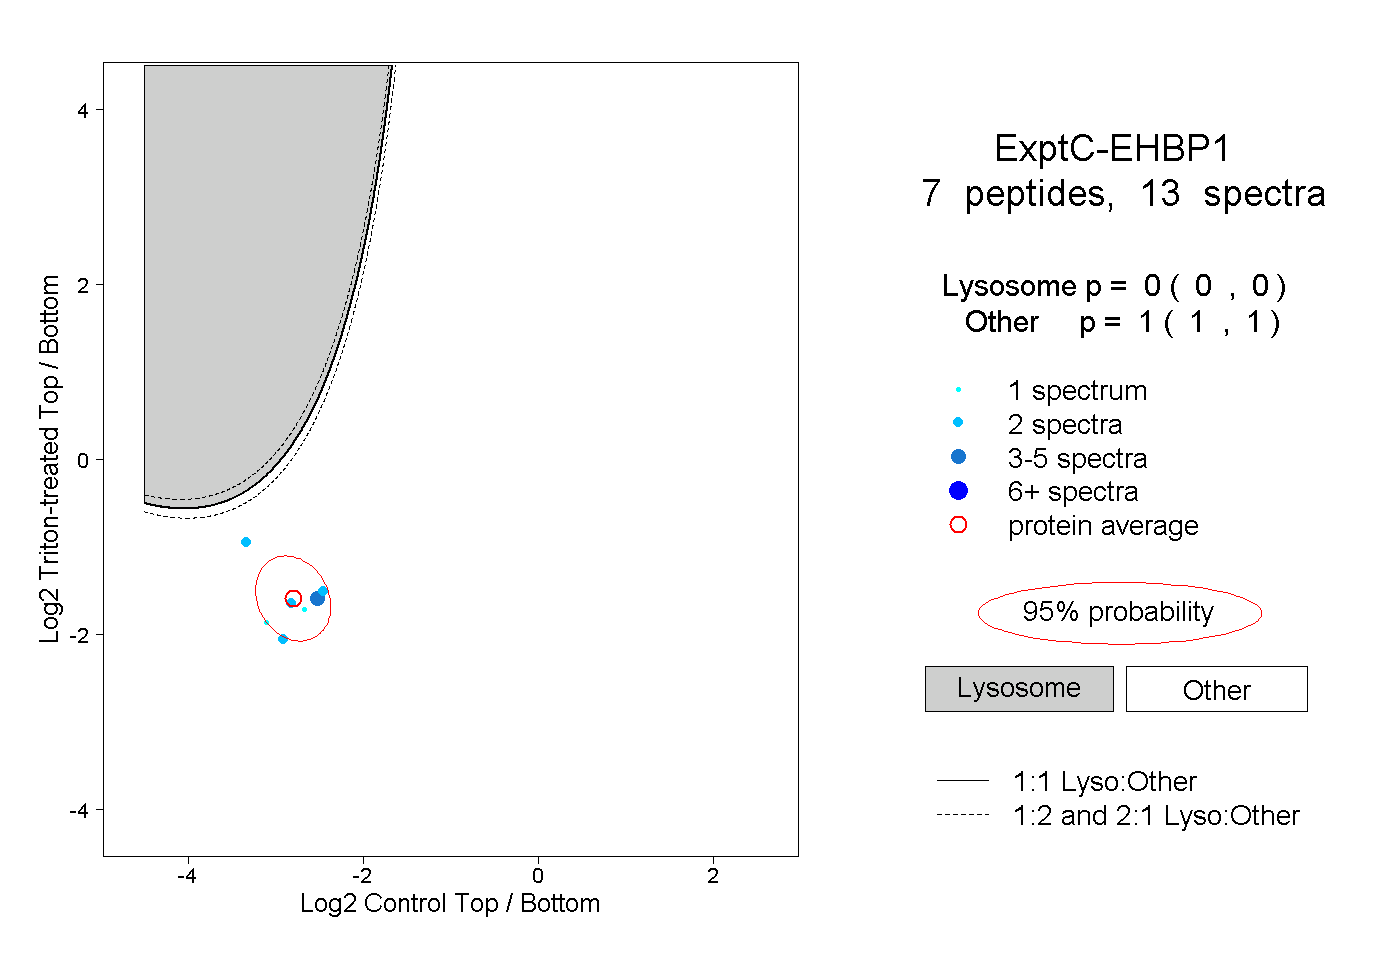 |
0.000 0.000 | 0.000 |
1.000 1.000 | 1.000 |
||||||||
| Plot | Lyso | Other | |||||||||||
| Expt D |
1 peptide |
1 spectrum |
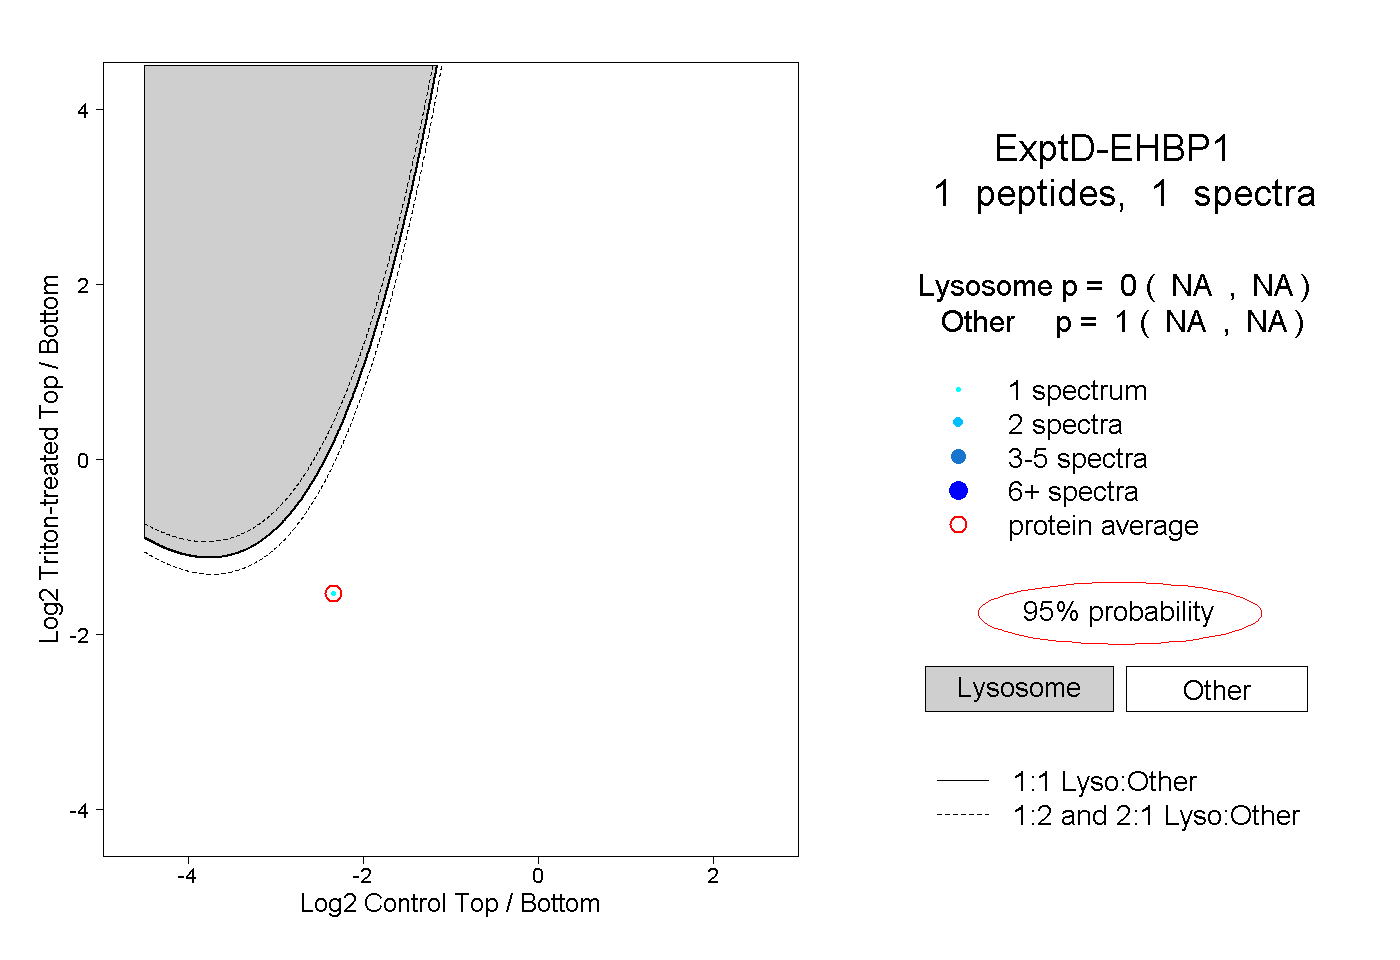 |
0.000 NA | NA |
1.000 NA | NA |