 29
29peptides
spectra
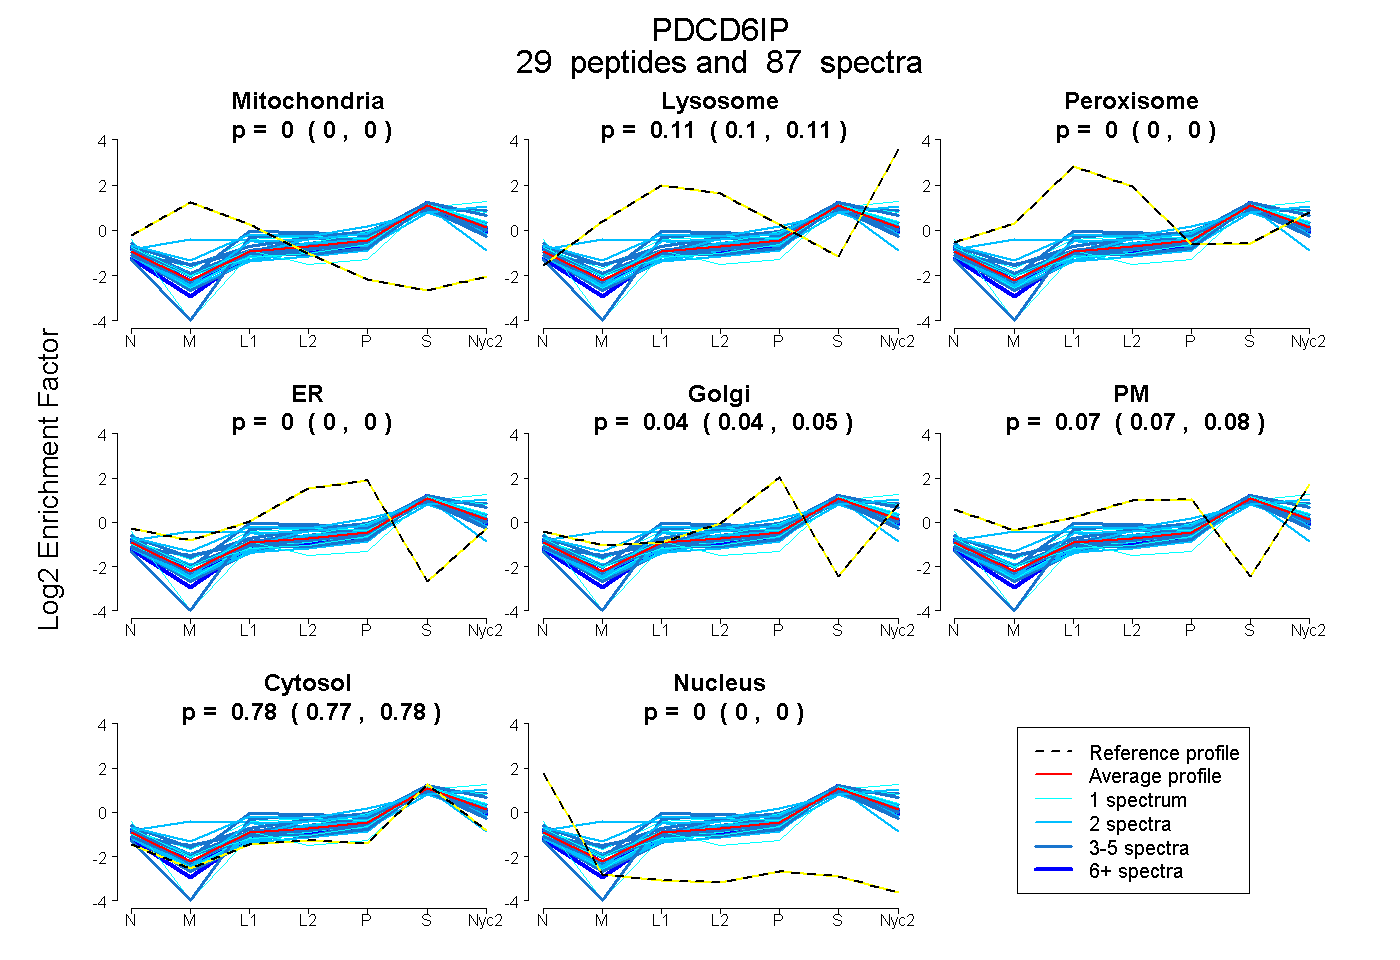
0.000 | 0.000
0.102 | 0.109
0.000 | 0.000
0.000 | 0.000
0.039 | 0.049
0.067 | 0.078
0.774 | 0.778
0.000 | 0.000
11peptides
spectra
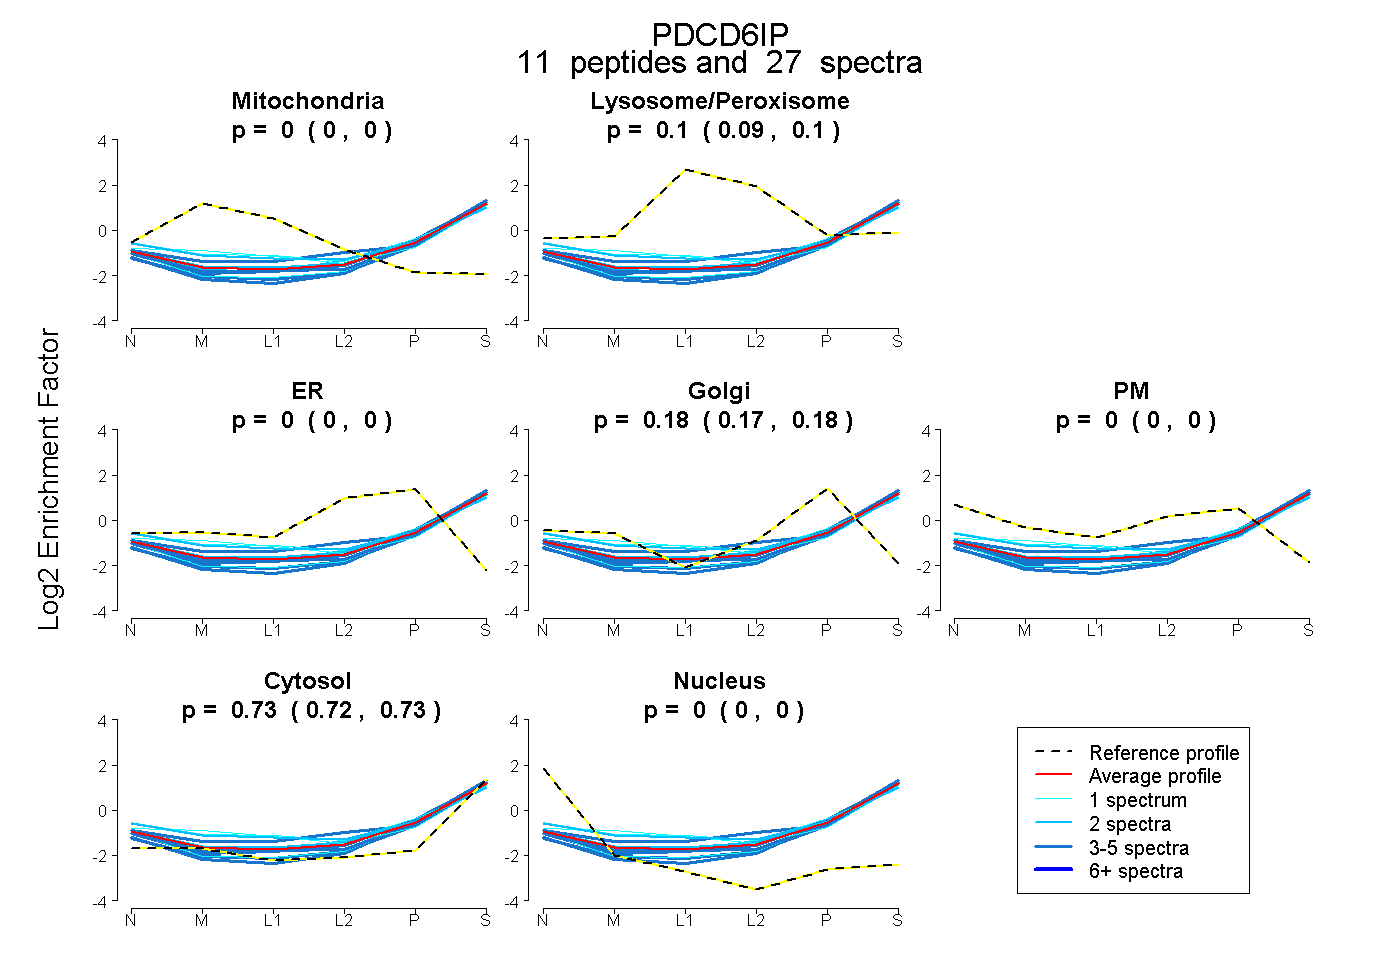
0.000 | 0.000
0.090 | 0.103
0.000 | 0.000
0.172 | 0.181
0.000 | 0.000
0.722 | 0.730
0.000 | 0.000
36peptides
spectra
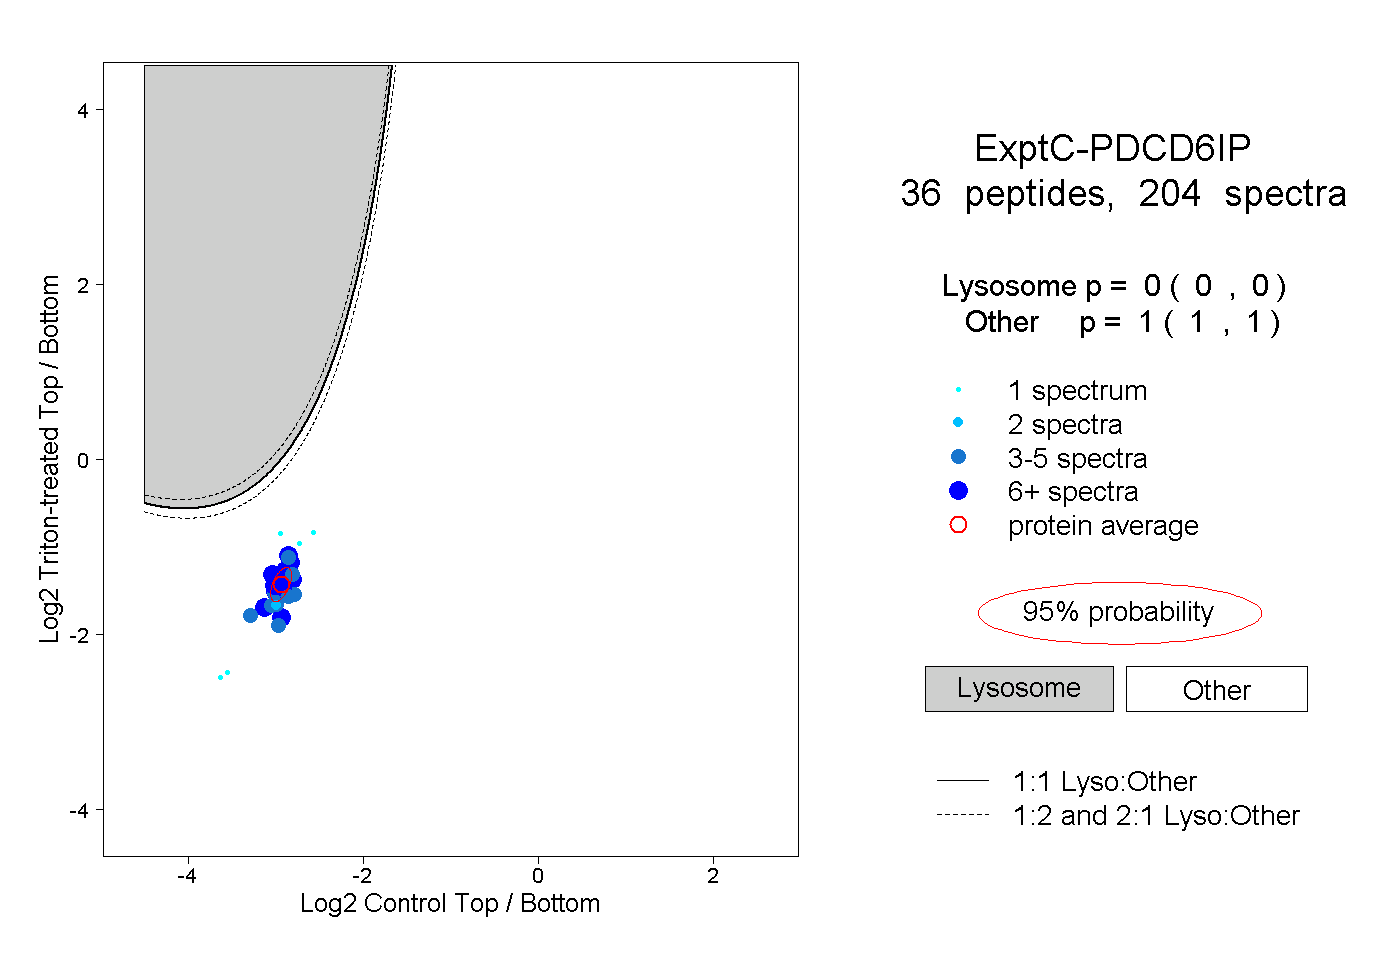
0.000 | 0.000
1.000 | 1.000
12peptides
spectra
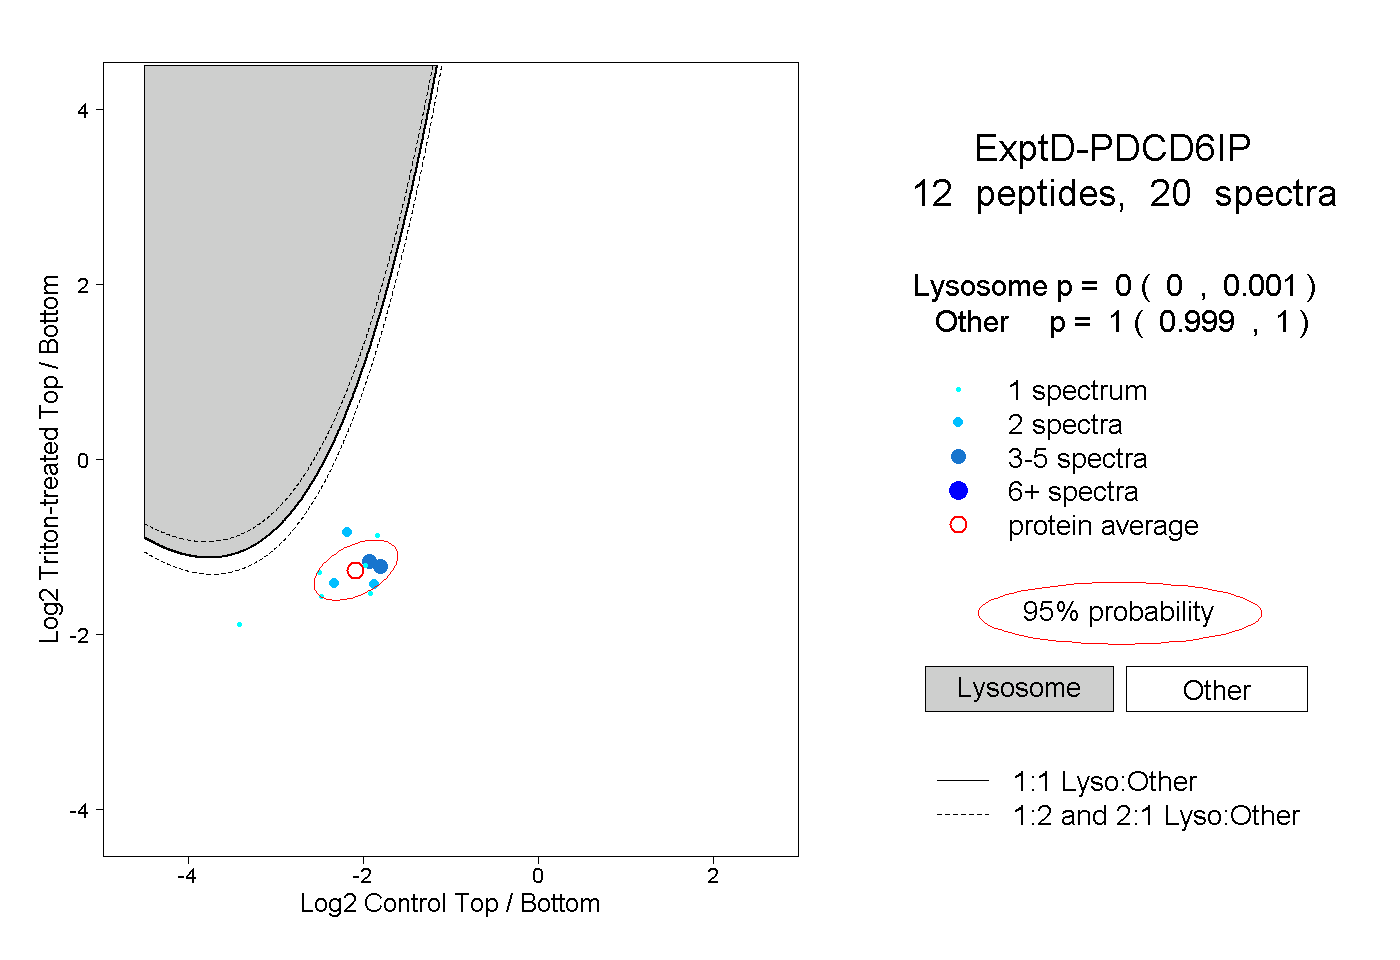
0.000 | 0.001
0.999 | 1.000