PDCD6IP
[ENSRNOP00000012114]
Main page
| | | Plot |
Mito |
Lyso |
|
Perox |
ER |
Golgi |
PM |
Cytosol |
Nucleus |
|
| Expt A |
 29
29
peptides |
87
spectra |
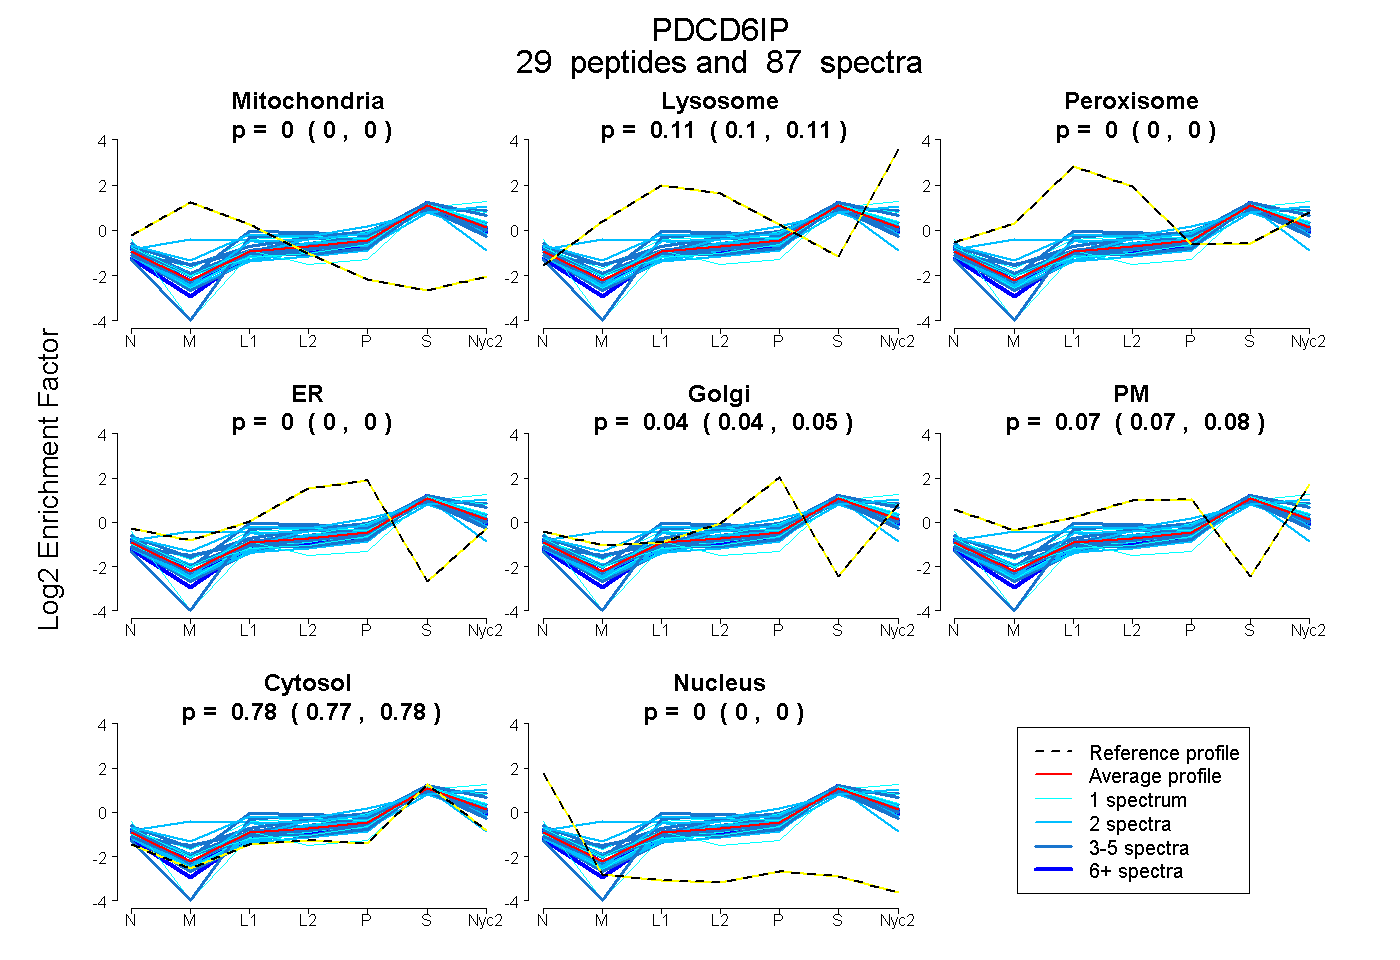 |
0.000
0.000 | 0.000 |
0.106
0.102 | 0.109 |
|
0.000
0.000 | 0.000 |
0.000
0.000 | 0.000 |
0.045
0.039 | 0.049 |
0.073
0.067 | 0.078 |
0.776
0.774 | 0.778 |
0.000
0.000 | 0.000 |
|
| | | Plot |
Mito |
|
Lyso or Perox |
|
ER |
Golgi |
PM |
Cytosol |
Nucleus |
|
| Expt B |
11
peptides |
27
spectra |
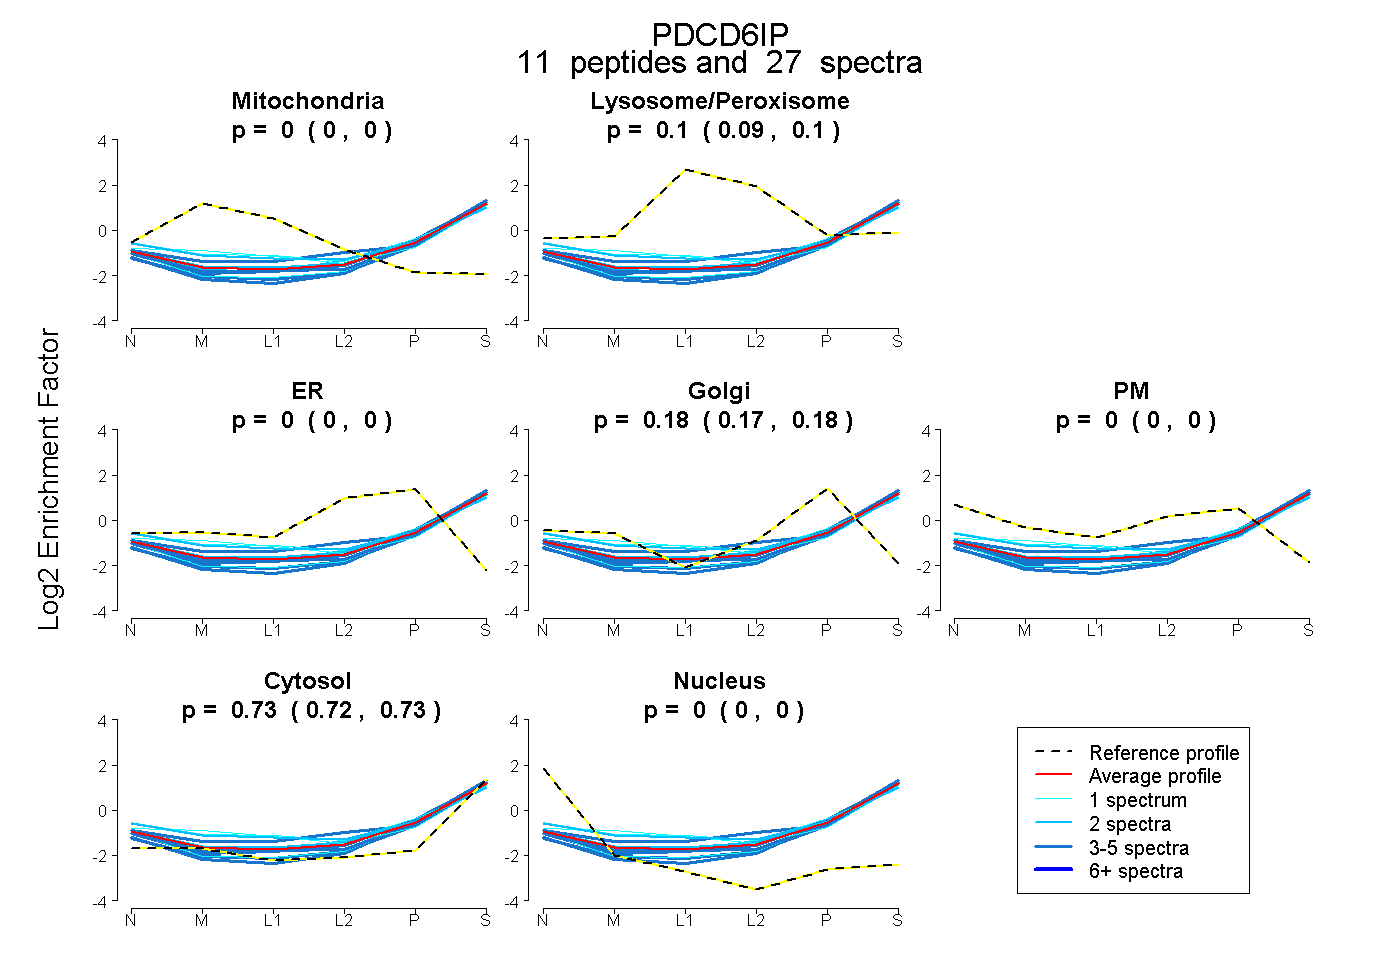 |
0.000
0.000 | 0.000 |
|
0.097
0.090 | 0.103 |
|
0.000
0.000 | 0.000 |
0.177
0.172 | 0.181 |
0.000
0.000 | 0.000 |
0.726
0.722 | 0.730 |
0.000
0.000 | 0.000 |
|
| 1 spectrum, LALASLGYEK |
0.000 |
|
0.161 |
|
0.000 |
0.053 |
0.107 |
0.679 |
0.000 |
|
| 4 spectra, DTVLSALSR |
0.000 |
|
0.005 |
|
0.000 |
0.159 |
0.000 |
0.836 |
0.000 |
|
| 2 spectra, YYDQICSIEPK |
0.000 |
|
0.150 |
|
0.000 |
0.077 |
0.144 |
0.630 |
0.000 |
|
| 3 spectra, FTDLFEK |
0.000 |
|
0.069 |
|
0.000 |
0.163 |
0.000 |
0.768 |
0.000 |
|
| 2 spectra, FYNELTEILVR |
0.000 |
|
0.114 |
|
0.000 |
0.167 |
0.000 |
0.718 |
0.000 |
|
| 1 spectrum, TMQGSEVVNVLK |
0.000 |
|
0.160 |
|
0.000 |
0.112 |
0.128 |
0.600 |
0.000 |
|
| 1 spectrum, ELPELLQR |
0.000 |
|
0.018 |
|
0.000 |
0.184 |
0.000 |
0.798 |
0.000 |
|
| 3 spectra, DNDFIYHDR |
0.000 |
|
0.195 |
|
0.000 |
0.120 |
0.015 |
0.670 |
0.000 |
|
| 4 spectra, EILEESLR |
0.000 |
|
0.000 |
|
0.000 |
0.181 |
0.000 |
0.819 |
0.000 |
|
| 2 spectra, CSDIVFAR |
0.000 |
|
0.088 |
|
0.000 |
0.208 |
0.000 |
0.704 |
0.000 |
|
| 4 spectra, DLQQSIAR |
0.000 |
|
0.075 |
|
0.000 |
0.189 |
0.000 |
0.736 |
0.000 |
|
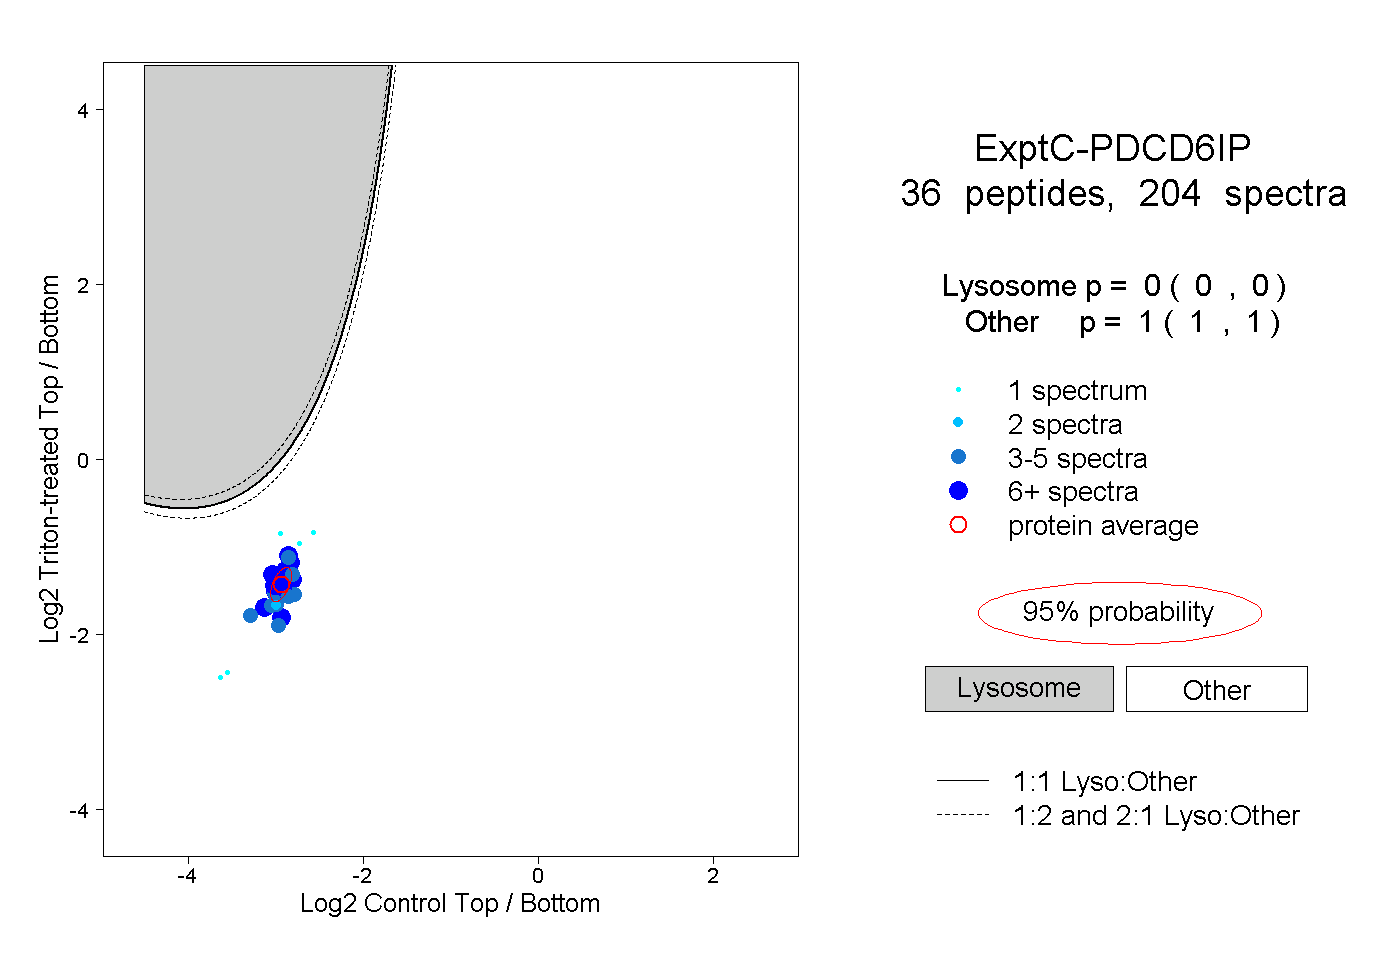
| | | Plot |
|
Lyso |
|
|
|
|
|
|
|
Other |
| Expt C |
36
peptides |
204
spectra |
 |
|
0.000
0.000 | 0.000 |
|
|
|
|
|
|
|
1.000
1.000 | 1.000 |
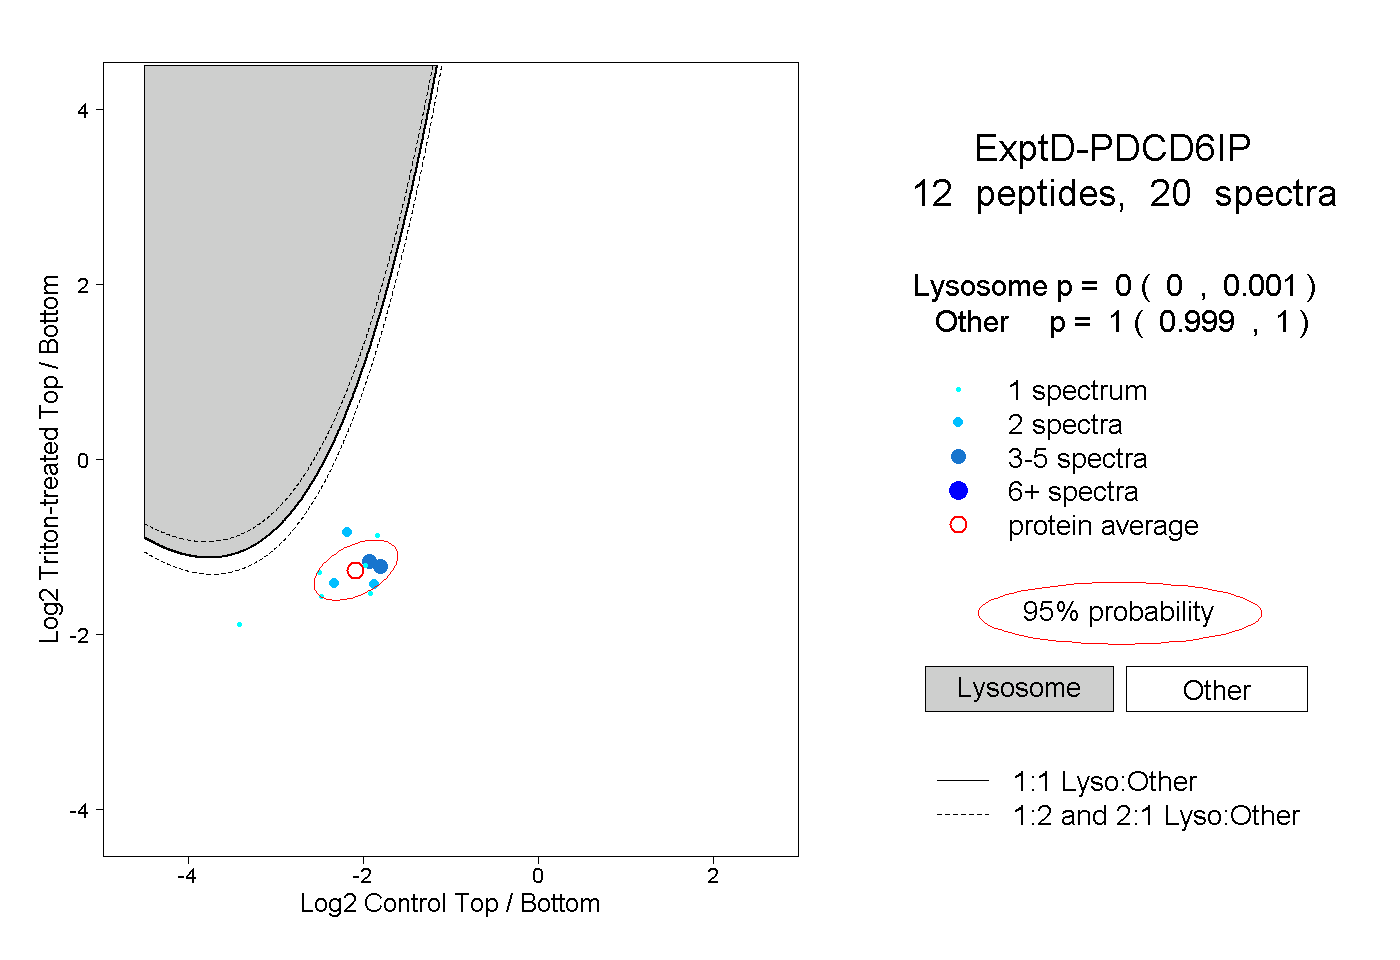
| | | Plot |
|
Lyso |
|
|
|
|
|
|
|
Other |
| Expt D |
12
peptides |
20
spectra |
 |
|
0.000
0.000 | 0.001 |
|
|
|
|
|
|
|
1.000
0.999 | 1.000 |