 7
7peptides
spectra
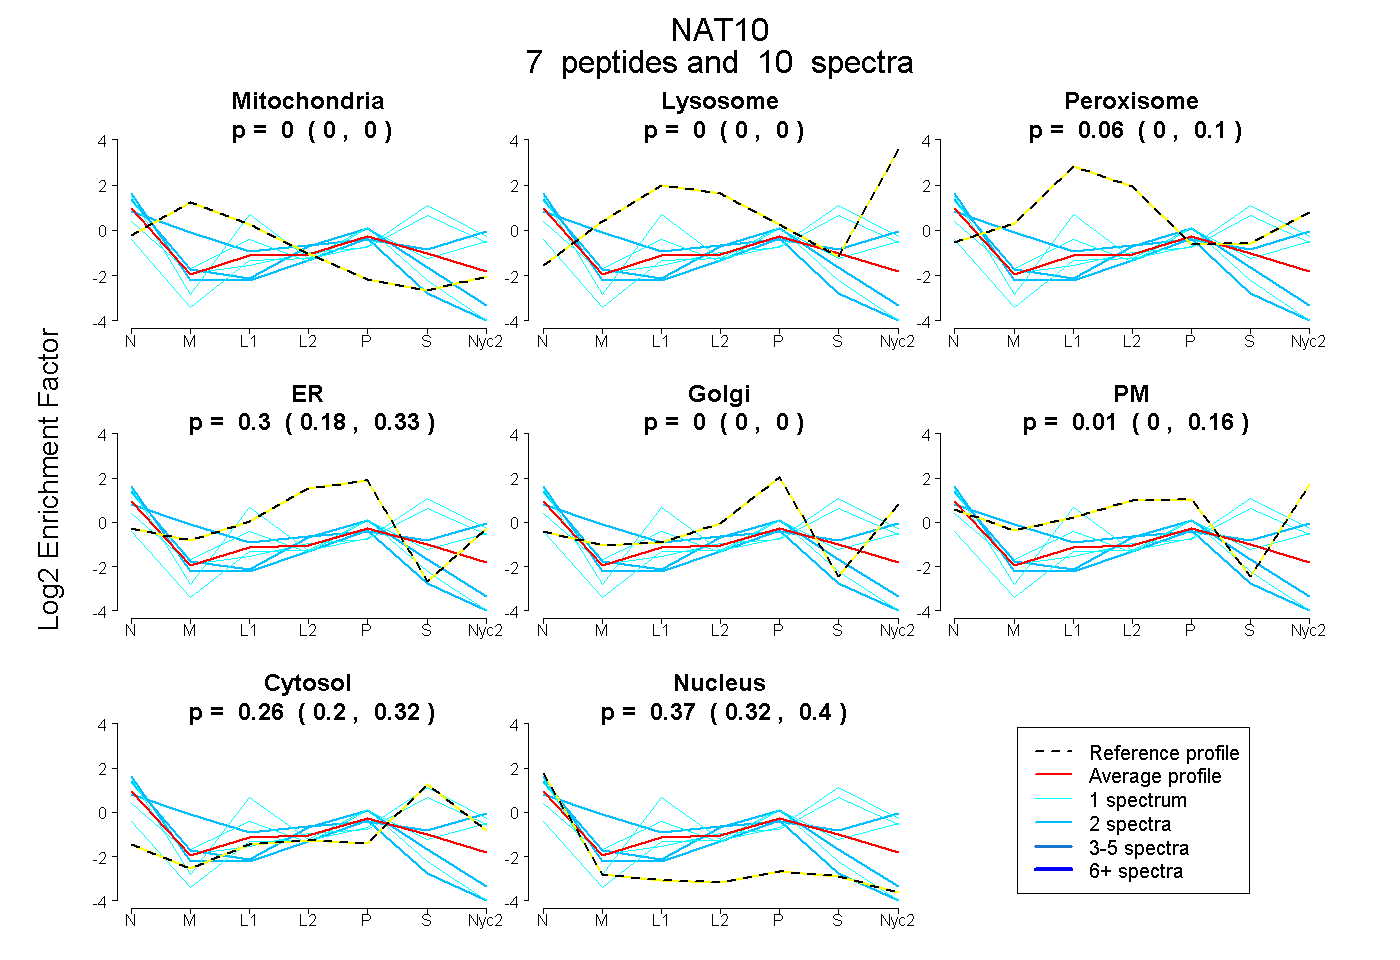
0.000 | 0.000
0.000 | 0.000
0.000 | 0.098
0.175 | 0.333
0.000 | 0.000
0.000 | 0.155
0.197 | 0.321
0.322 | 0.404
2peptides
spectra
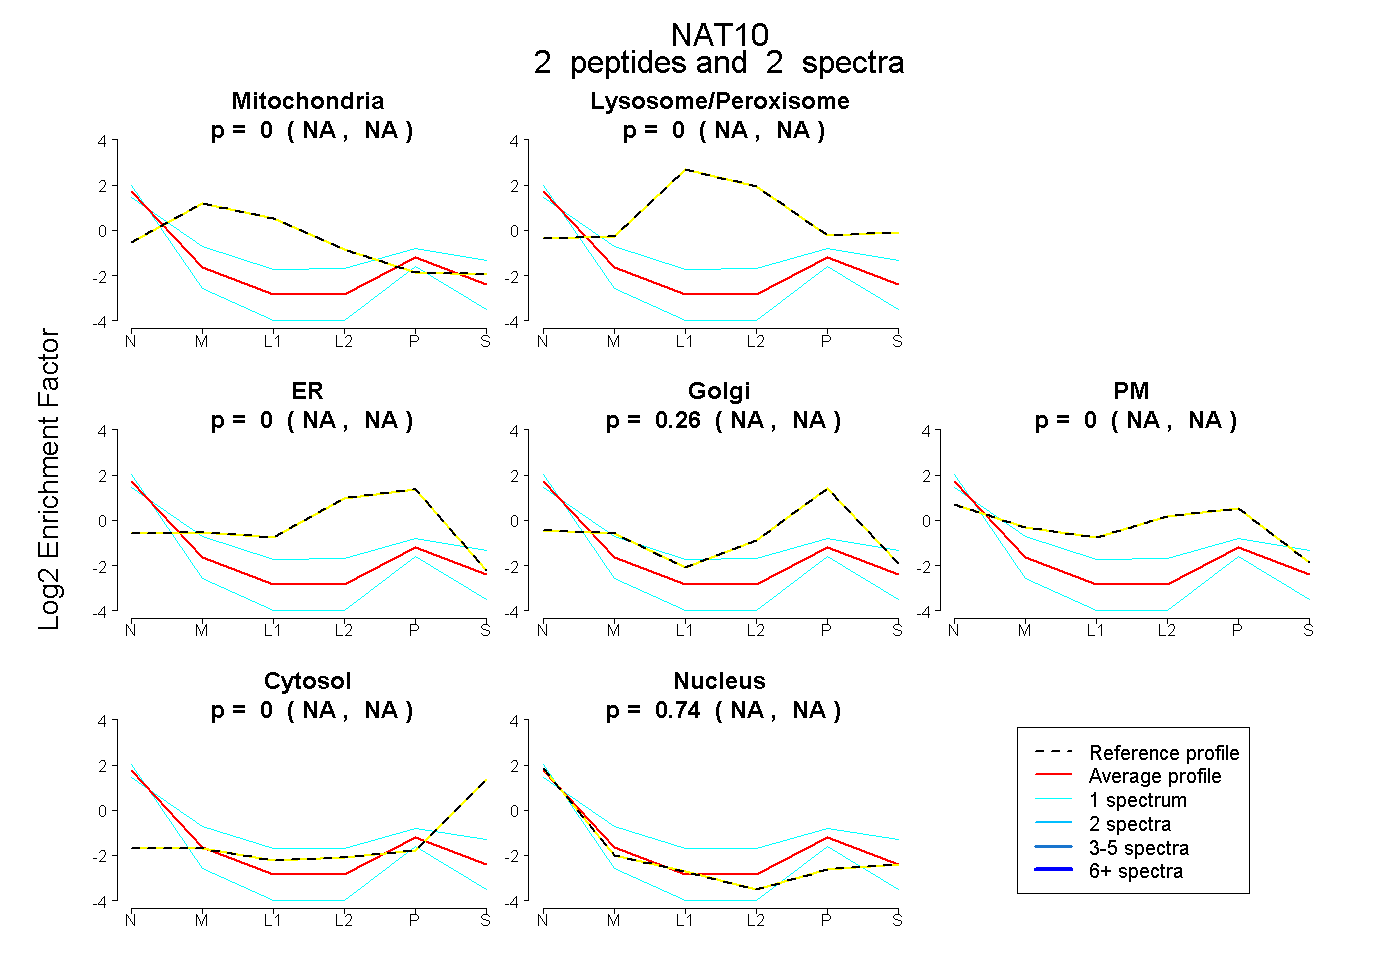
NA | NA
NA | NA
NA | NA
NA | NA
NA | NA
NA | NA
NA | NA
1peptide
spectra
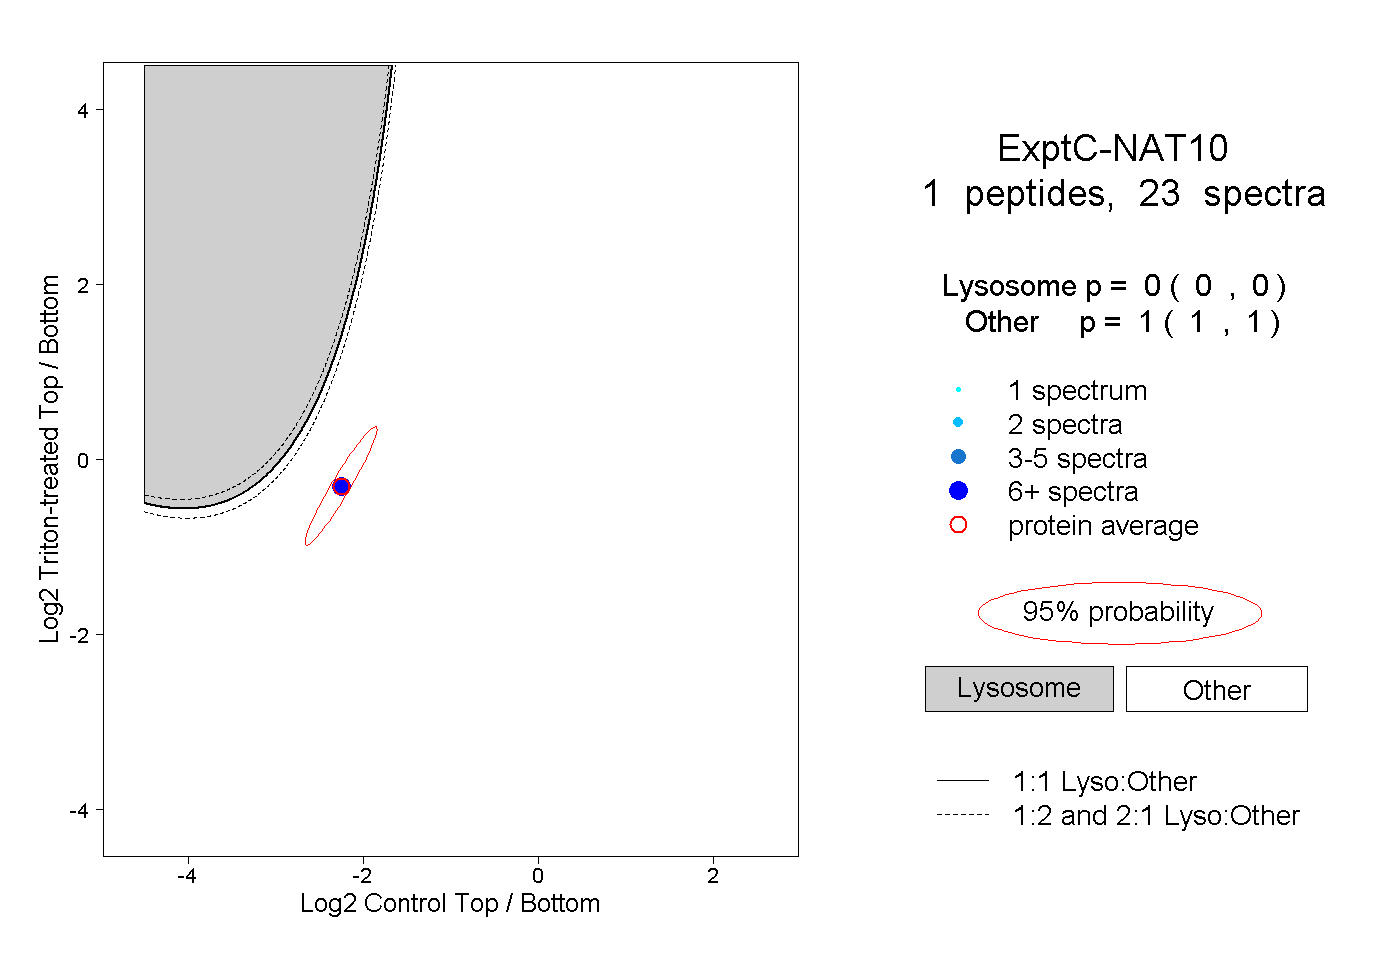
0.000 | 0.000
1.000 | 1.000