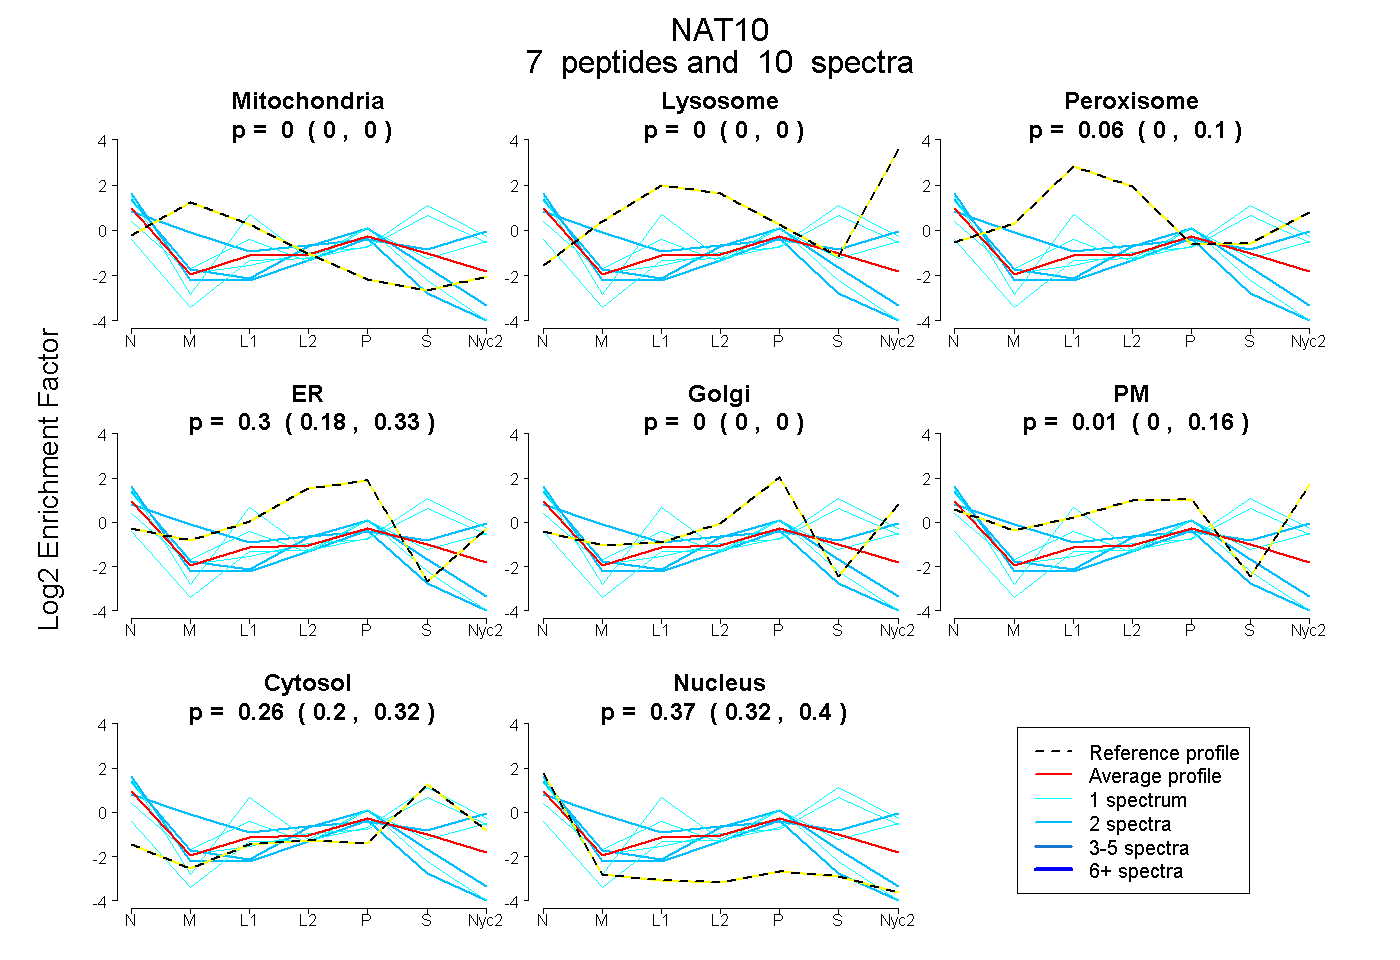
 7
7peptides
spectra
0.000 | 0.000
0.000 | 0.000
0.000 | 0.098
0.175 | 0.333
0.000 | 0.000
0.000 | 0.155
0.197 | 0.321
0.322 | 0.404
| Plot | Mito | Lyso | Perox | ER | Golgi | PM | Cytosol | Nucleus | |||||
| Expt A |
7 peptides |
10 spectra |
|
0.000 0.000 | 0.000 |
0.000 0.000 | 0.000 |
0.056 0.000 | 0.098 |
0.303 0.175 | 0.333 |
0.000 0.000 | 0.000 |
0.008 0.000 | 0.155 |
0.264 0.197 | 0.321 |
0.369 0.322 | 0.404 |
| 2 spectra, FIEGISEK | 0.000 | 0.000 | 0.000 | 0.305 | 0.000 | 0.000 | 0.000 | 0.695 | ||
| 2 spectra, IAVHPDYQGMGYGSR | 0.191 | 0.000 | 0.000 | 0.000 | 0.000 | 0.453 | 0.260 | 0.095 | ||
| 1 spectrum, LFNDVQEK | 0.000 | 0.000 | 0.040 | 0.000 | 0.041 | 0.434 | 0.187 | 0.297 | ||
| 2 spectra, LNERPAER | 0.000 | 0.000 | 0.000 | 0.411 | 0.000 | 0.000 | 0.042 | 0.547 | ||
| 1 spectrum, TEAHQDVVGR | 0.000 | 0.000 | 0.000 | 0.000 | 0.060 | 0.045 | 0.875 | 0.020 | ||
| 1 spectrum, STVALTAAR | 0.000 | 0.000 | 0.127 | 0.318 | 0.000 | 0.000 | 0.000 | 0.555 | ||
| 1 spectrum, FILSLASCK | 0.000 | 0.000 | 0.000 | 0.000 | 0.000 | 0.224 | 0.656 | 0.120 |
| Plot | Mito | Lyso or Perox | ER | Golgi | PM | Cytosol | Nucleus | ||||||
| Expt B |
2 peptides |
2 spectra |
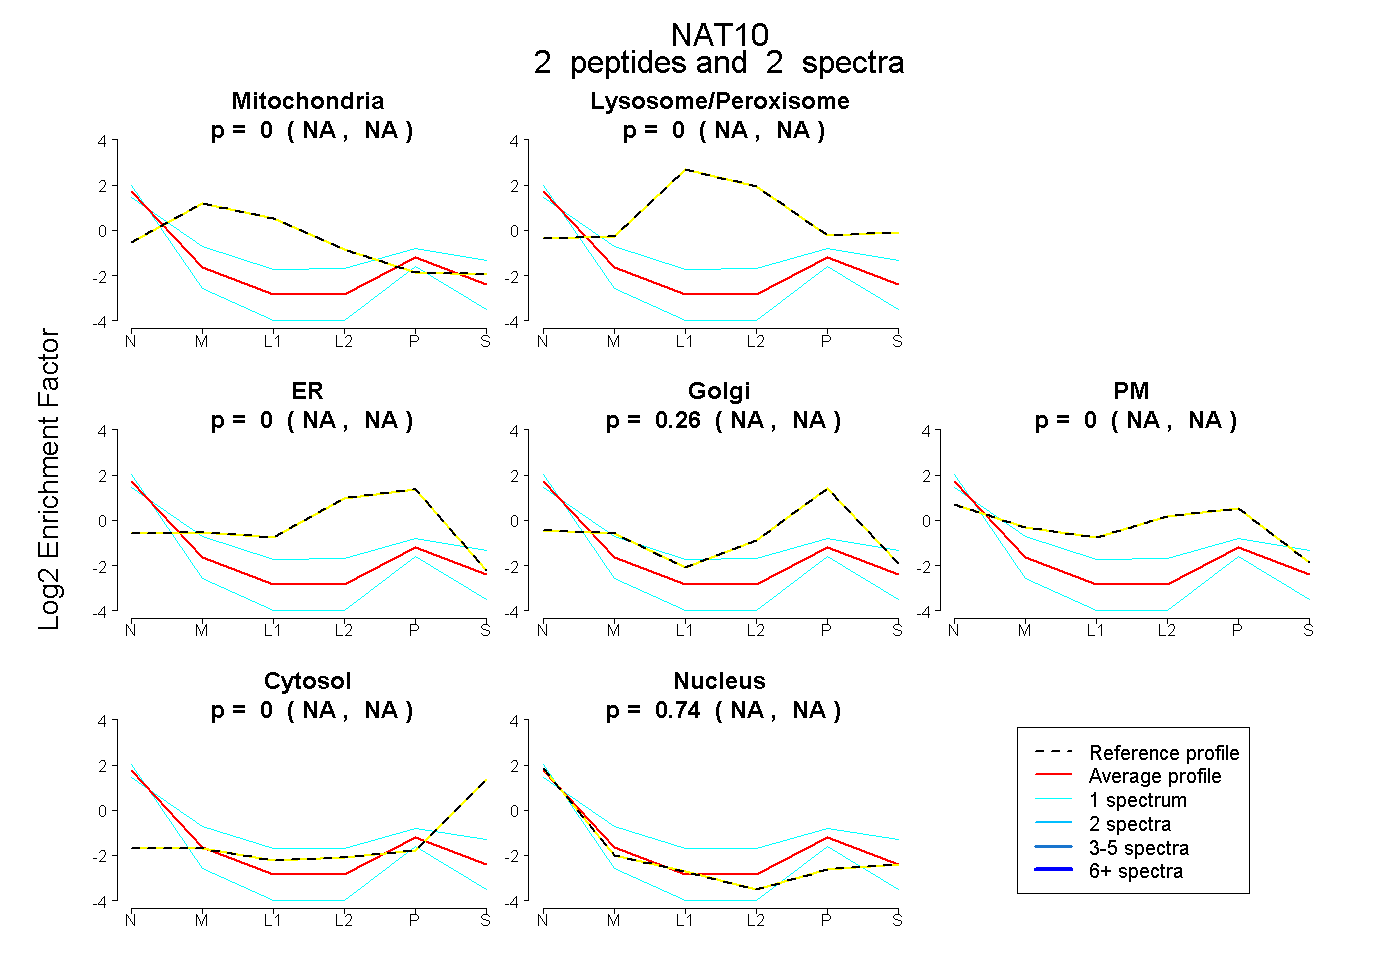 |
0.000 NA | NA |
0.000 NA | NA |
0.000 NA | NA |
0.259 NA | NA |
0.000 NA | NA |
0.000 NA | NA |
0.741 NA | NA |
|||
| Plot | Lyso | Other | |||||||||||
| Expt C |
1 peptide |
23 spectra |
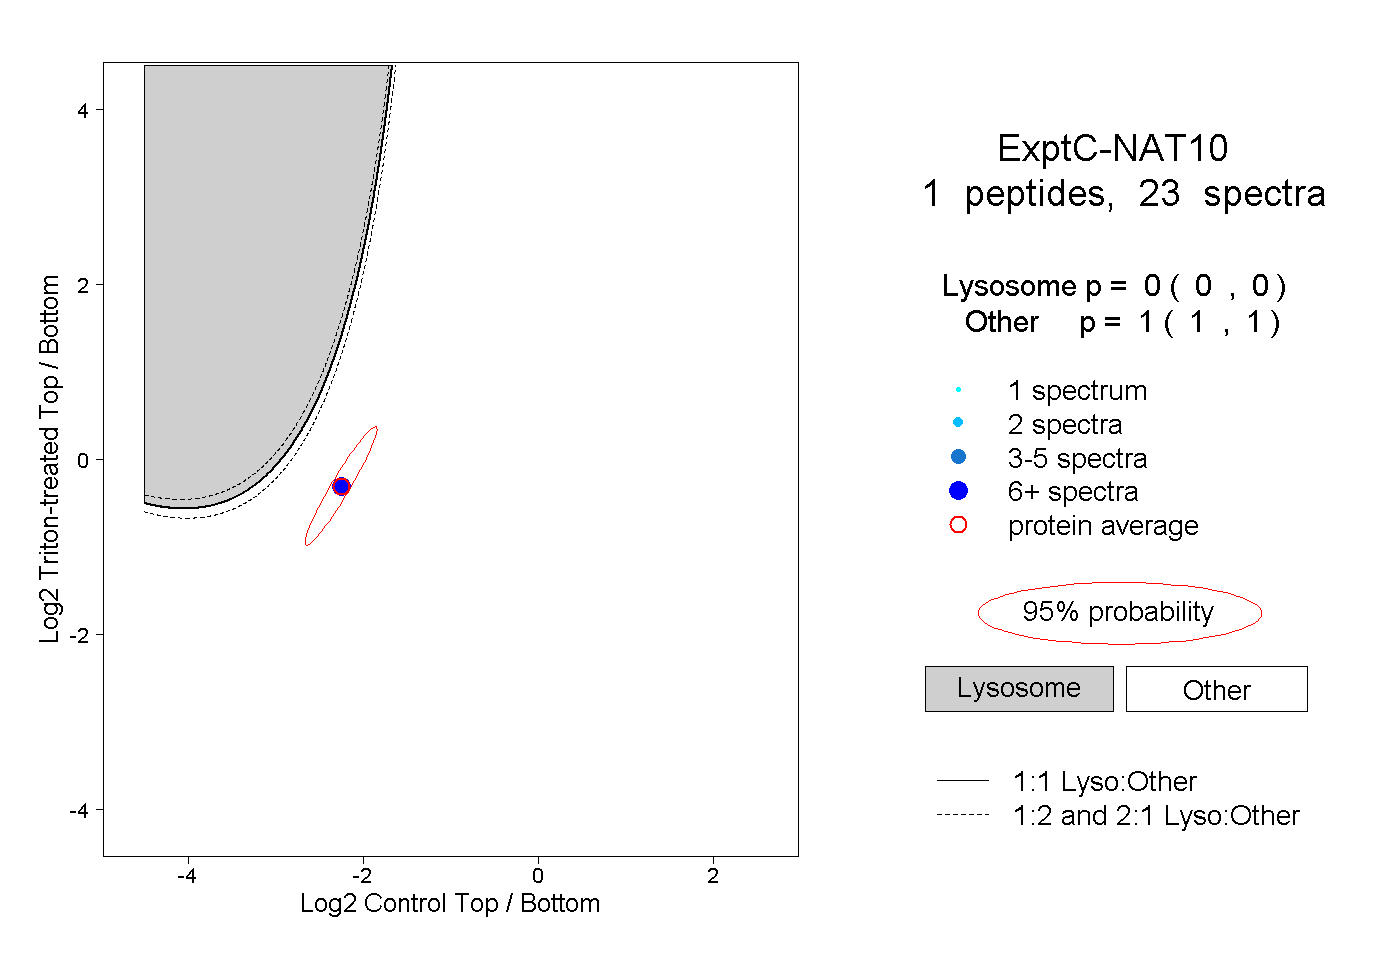 |
0.000 0.000 | 0.000 |
1.000 1.000 | 1.000 |