 5
5peptides
spectra
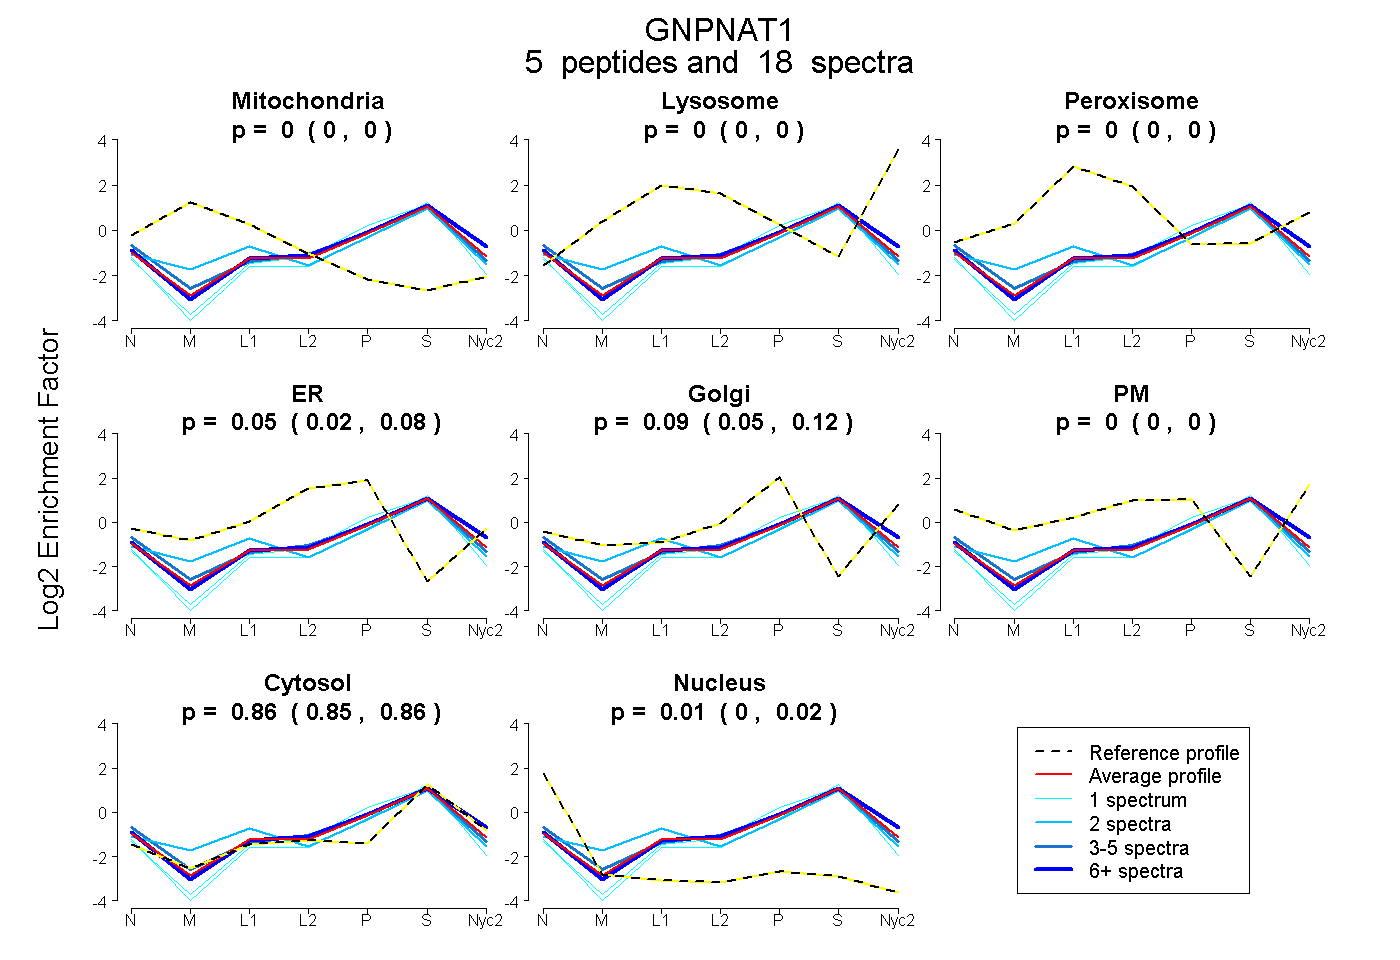
0.000 | 0.000
0.000 | 0.000
0.000 | 0.000
0.017 | 0.077
0.048 | 0.119
0.000 | 0.000
0.848 | 0.862
0.000 | 0.017
3peptides
spectra
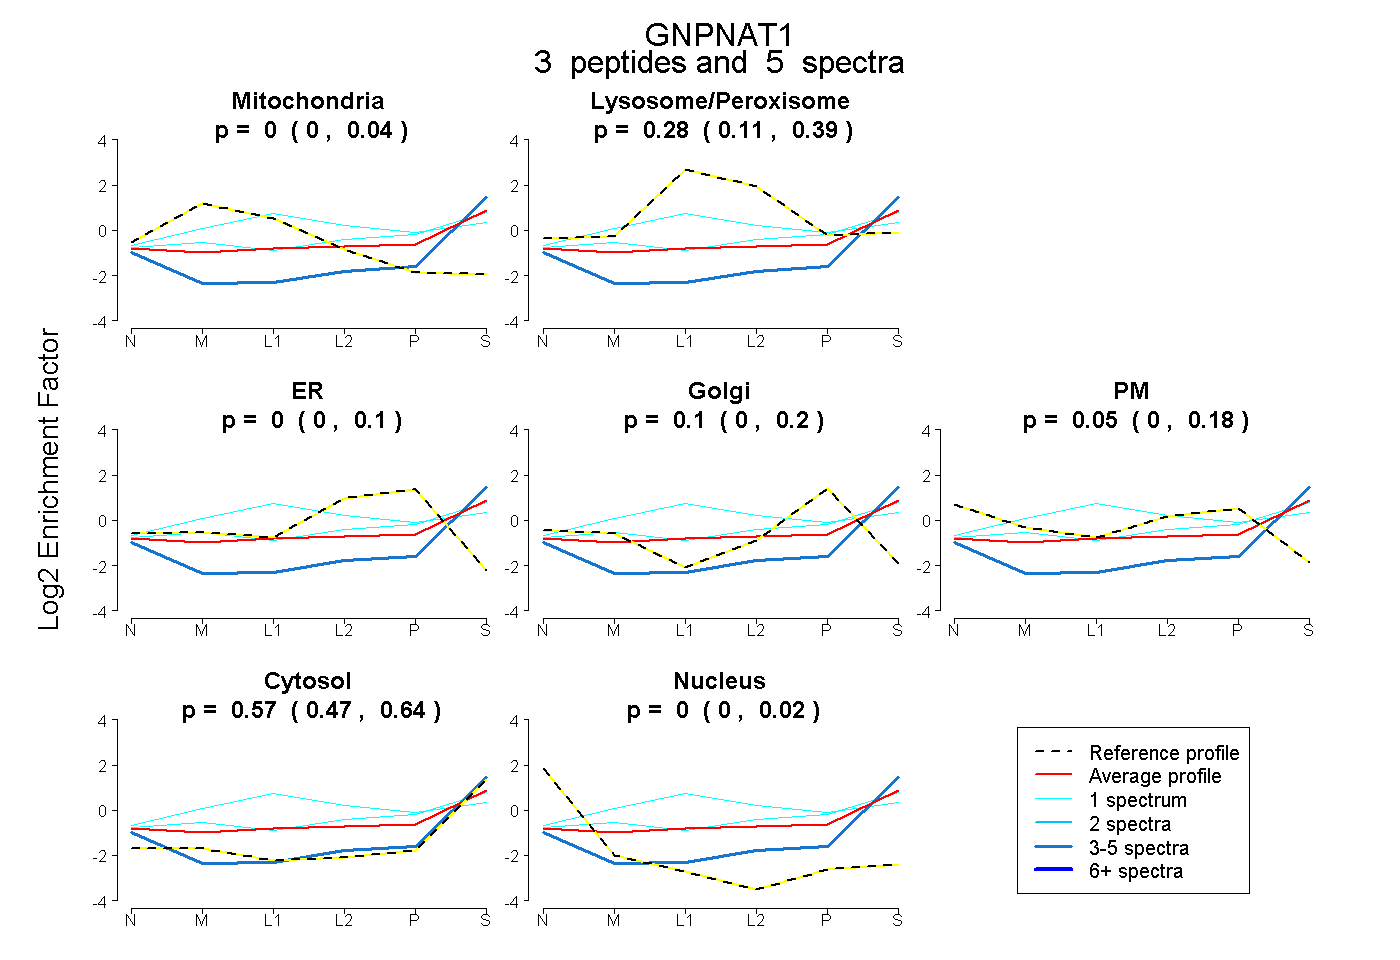
0.000 | 0.042
0.111 | 0.394
0.000 | 0.099
0.000 | 0.201
0.000 | 0.184
0.472 | 0.644
0.000 | 0.015
3peptides
spectra
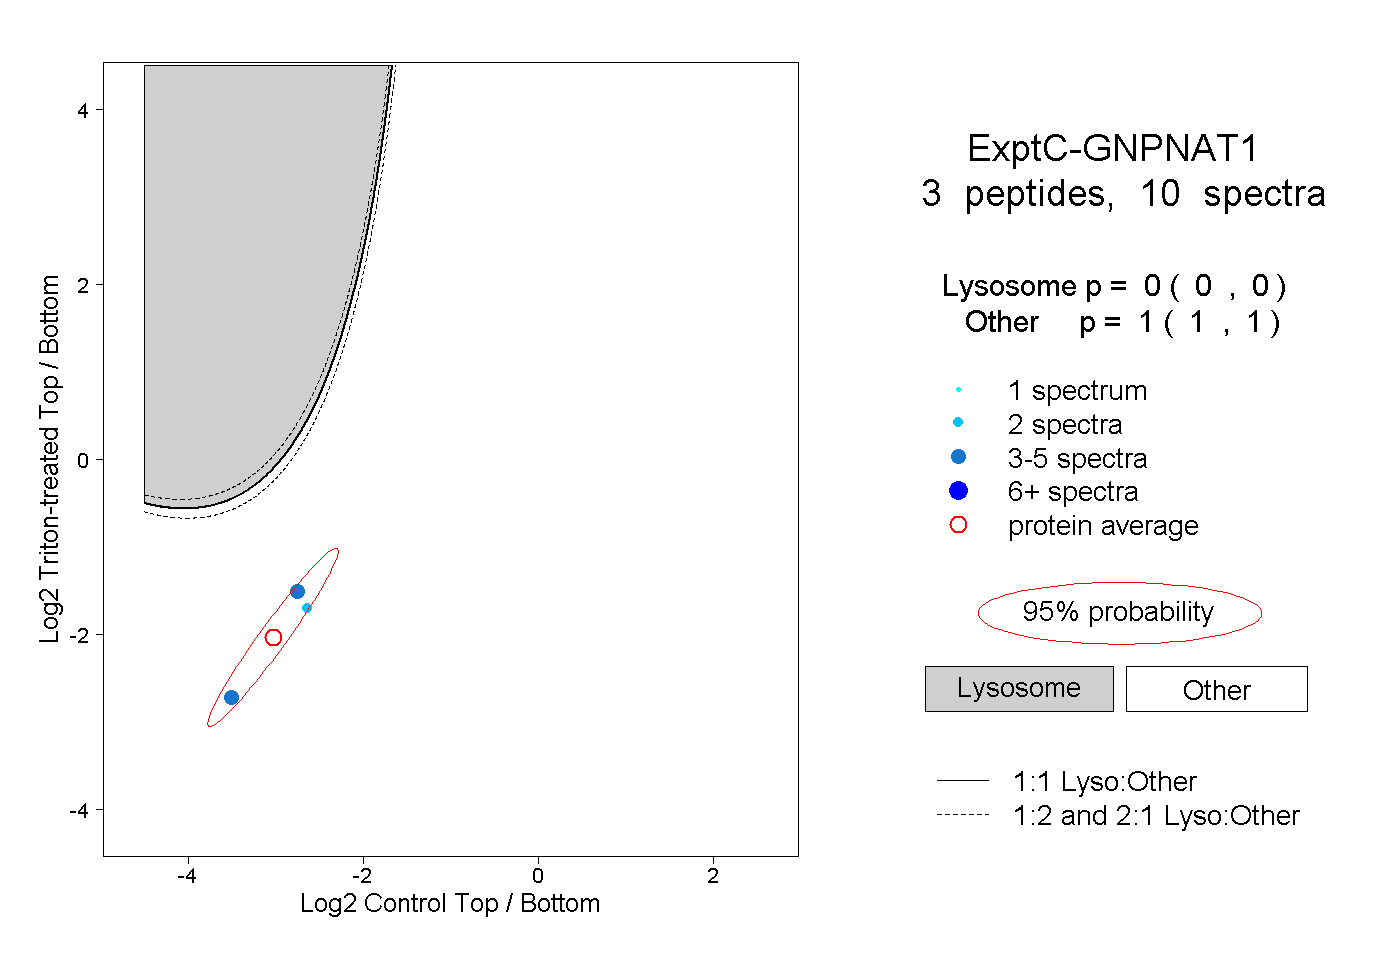
0.000 | 0.000
1.000 | 1.000
2peptides
spectra
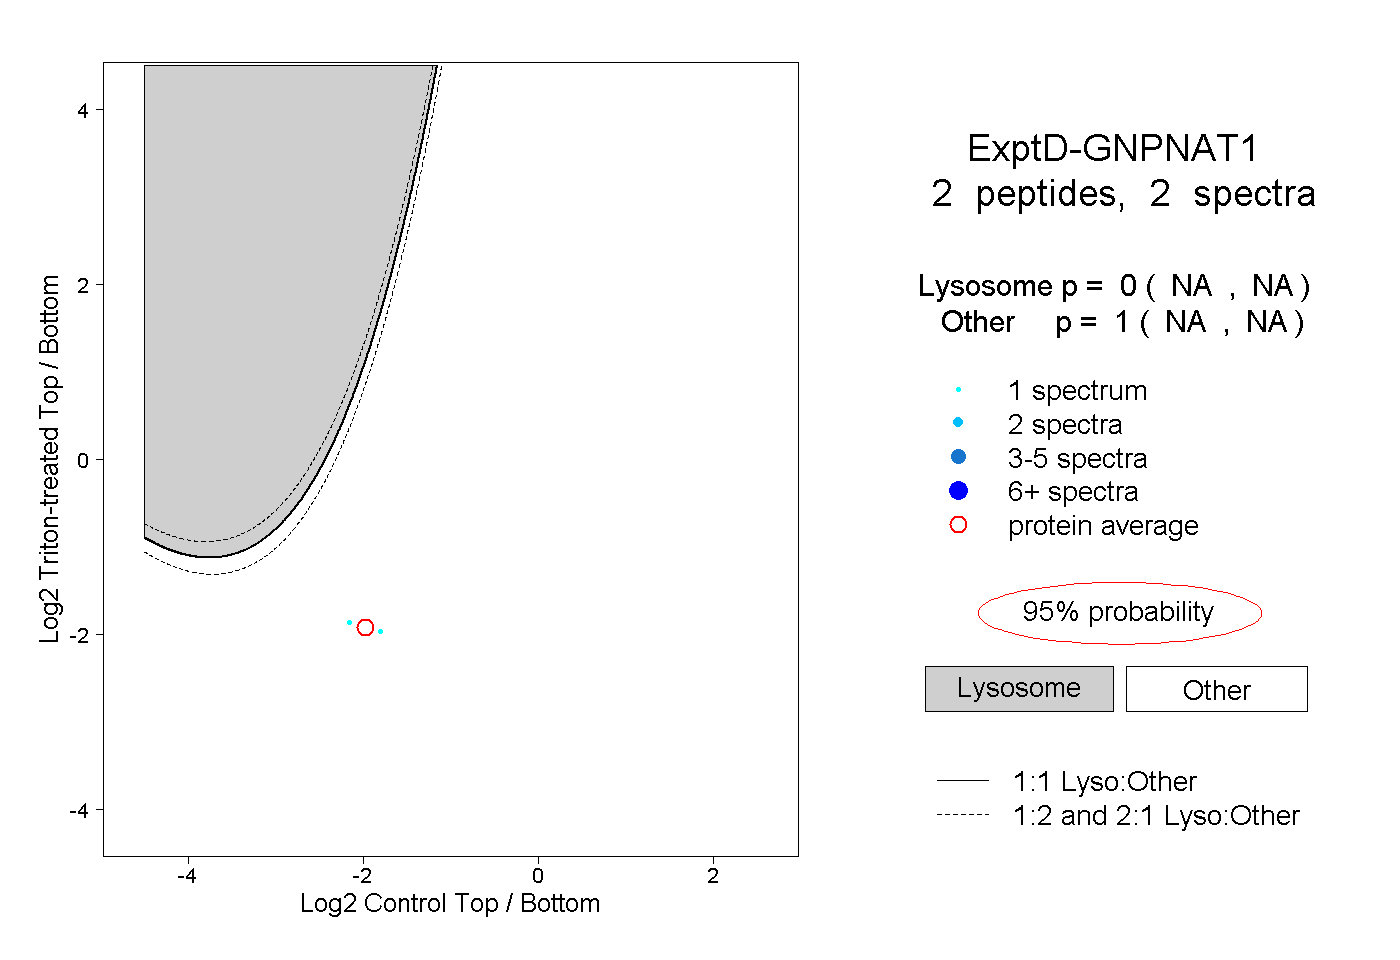
NA | NA
NA | NA