 5
5peptides
spectra
0.000 | 0.000
0.000 | 0.000
0.000 | 0.000
0.017 | 0.077
0.048 | 0.119
0.000 | 0.000
0.848 | 0.862
0.000 | 0.017
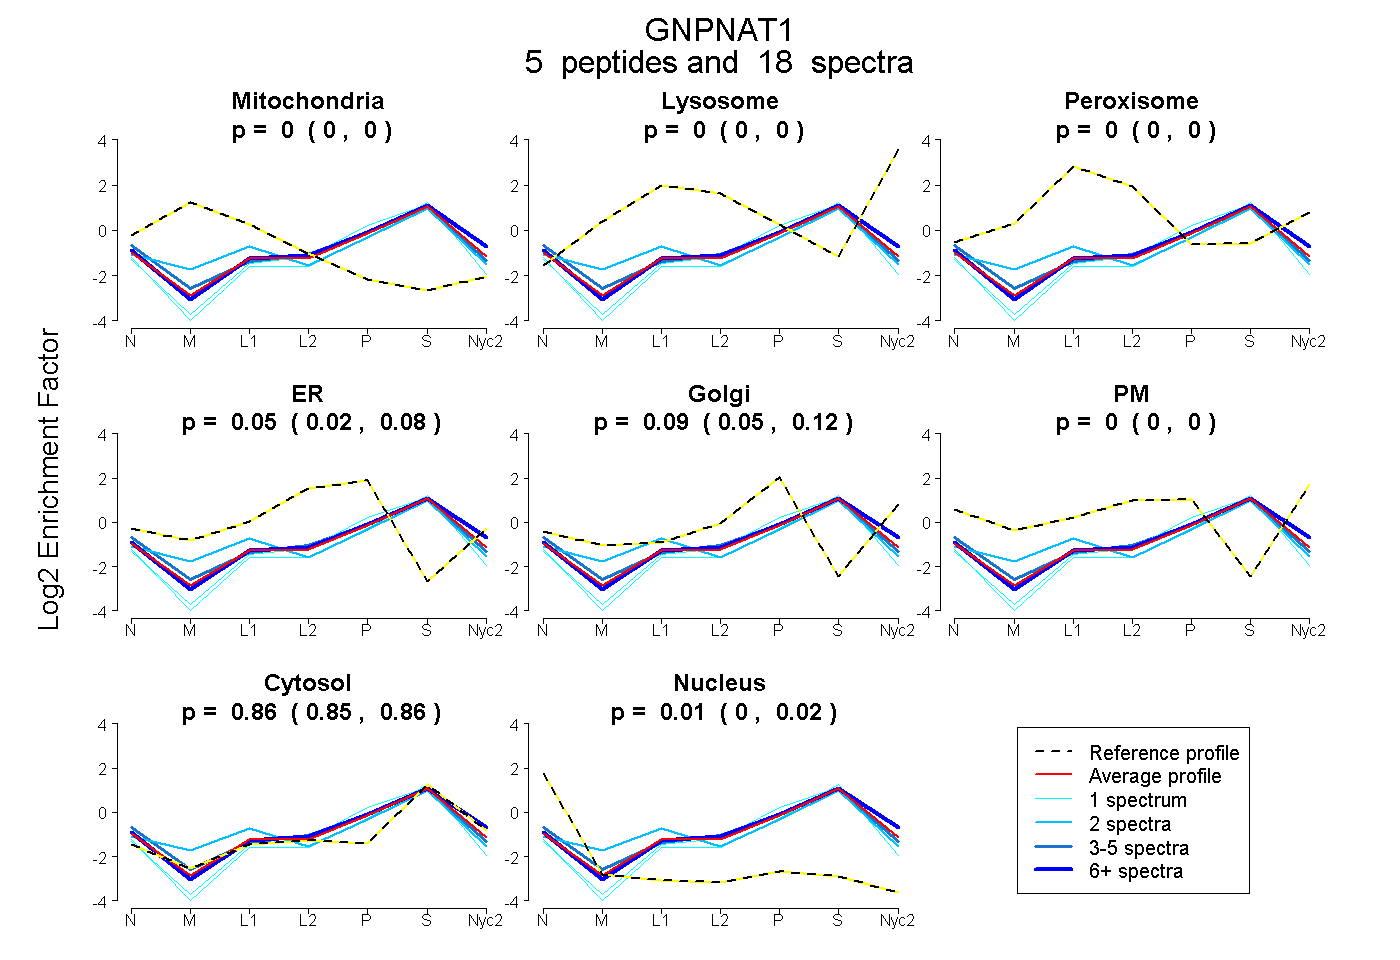
| Plot | Mito | Lyso | Perox | ER | Golgi | PM | Cytosol | Nucleus | |||||
| Expt A |
5 peptides |
18 spectra |
|
0.000 0.000 | 0.000 |
0.000 0.000 | 0.000 |
0.000 0.000 | 0.000 |
0.050 0.017 | 0.077 |
0.085 0.048 | 0.119 |
0.000 0.000 | 0.000 |
0.856 0.848 | 0.862 |
0.009 0.000 | 0.017 |
| 10 spectra, VEDVVVSDECR | 0.000 | 0.000 | 0.000 | 0.000 | 0.162 | 0.000 | 0.838 | 0.000 | ||
| 4 spectra, FIHSCAK | 0.000 | 0.000 | 0.000 | 0.144 | 0.008 | 0.000 | 0.809 | 0.040 | ||
| 1 spectrum, FDYTVSEENYMCR | 0.000 | 0.000 | 0.000 | 0.000 | 0.000 | 0.000 | 0.913 | 0.087 | ||
| 2 spectra, SFEHMK | 0.094 | 0.000 | 0.000 | 0.099 | 0.000 | 0.000 | 0.808 | 0.000 | ||
| 1 spectrum, MKPDETPMFDPSLLK | 0.000 | 0.000 | 0.000 | 0.000 | 0.145 | 0.000 | 0.855 | 0.000 |
| Plot | Mito | Lyso or Perox | ER | Golgi | PM | Cytosol | Nucleus | ||||||
| Expt B |
3 peptides |
5 spectra |
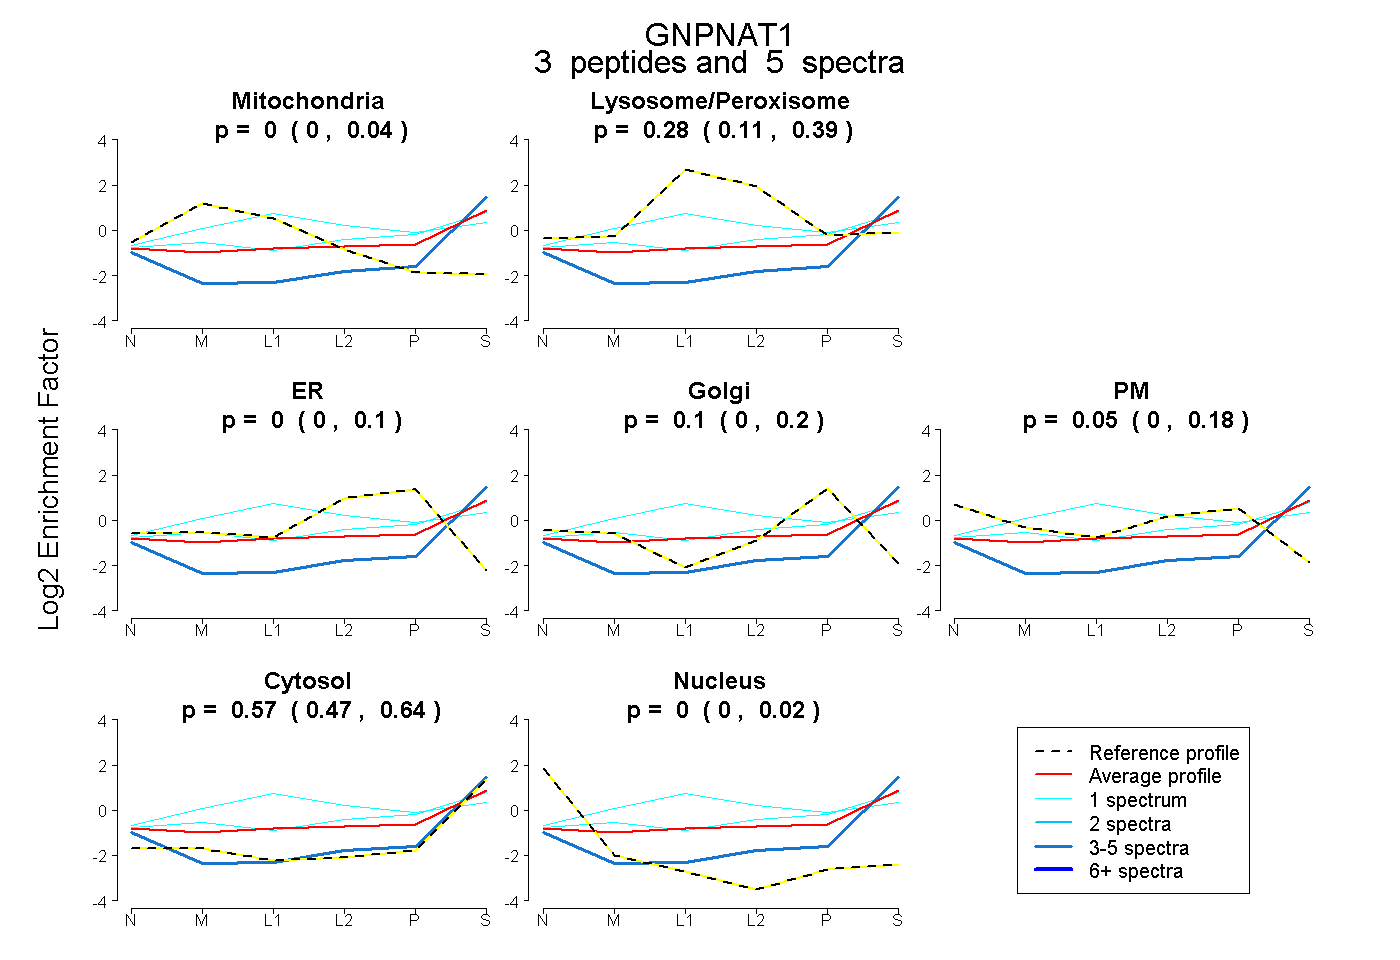 |
0.000 0.000 | 0.042 |
0.282 0.111 | 0.394 |
0.000 0.000 | 0.099 |
0.097 0.000 | 0.201 |
0.055 0.000 | 0.184 |
0.567 0.472 | 0.644 |
0.000 0.000 | 0.015 |
|||
| Plot | Lyso | Other | |||||||||||
| Expt C |
3 peptides |
10 spectra |
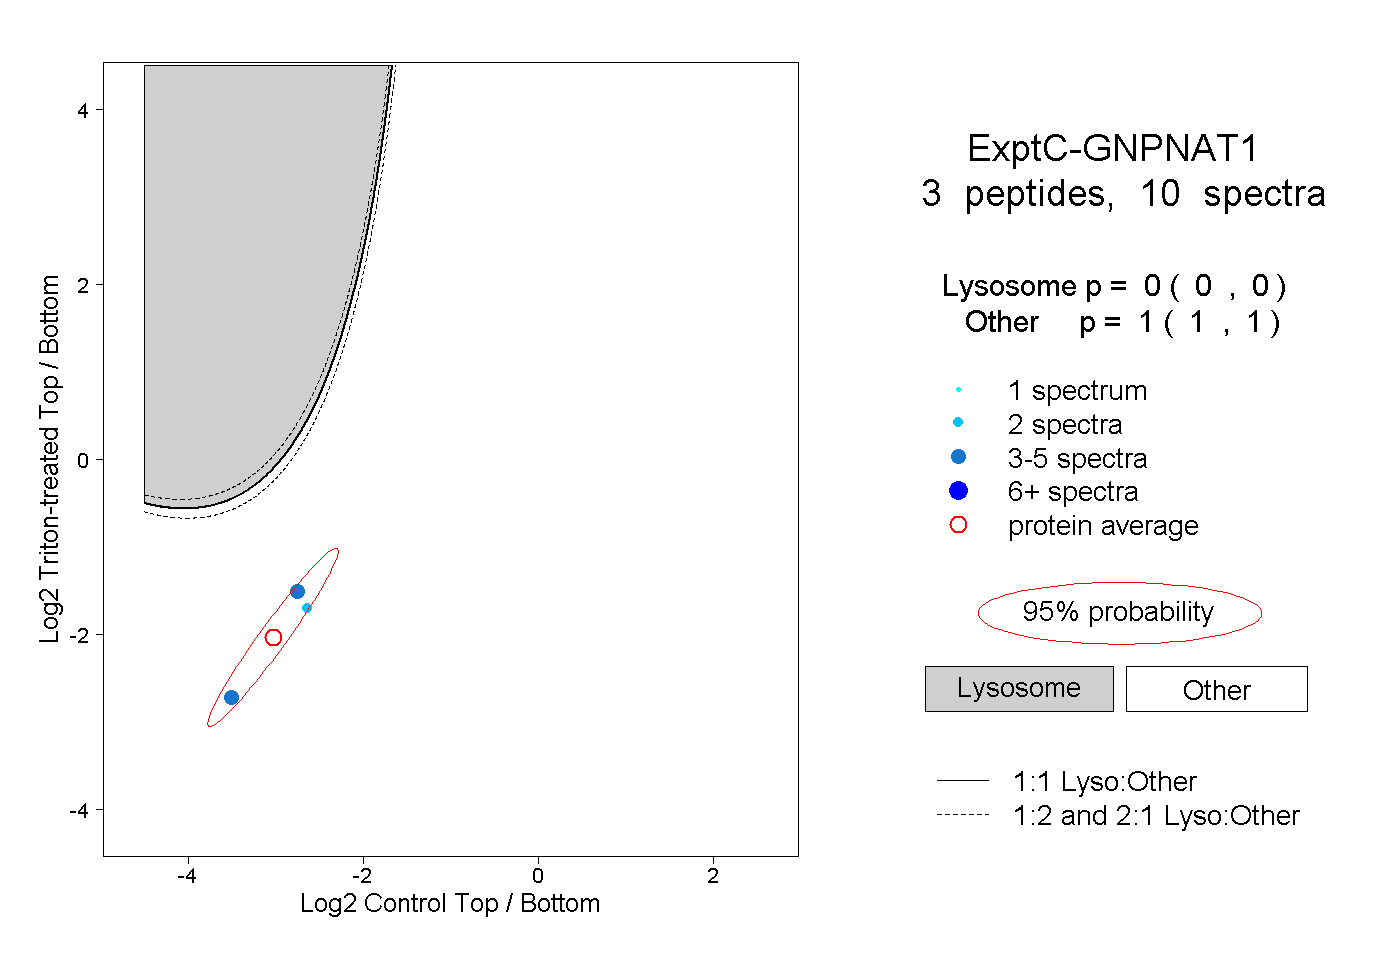 |
0.000 0.000 | 0.000 |
1.000 1.000 | 1.000 |
||||||||
| Plot | Lyso | Other | |||||||||||
| Expt D |
2 peptides |
2 spectra |
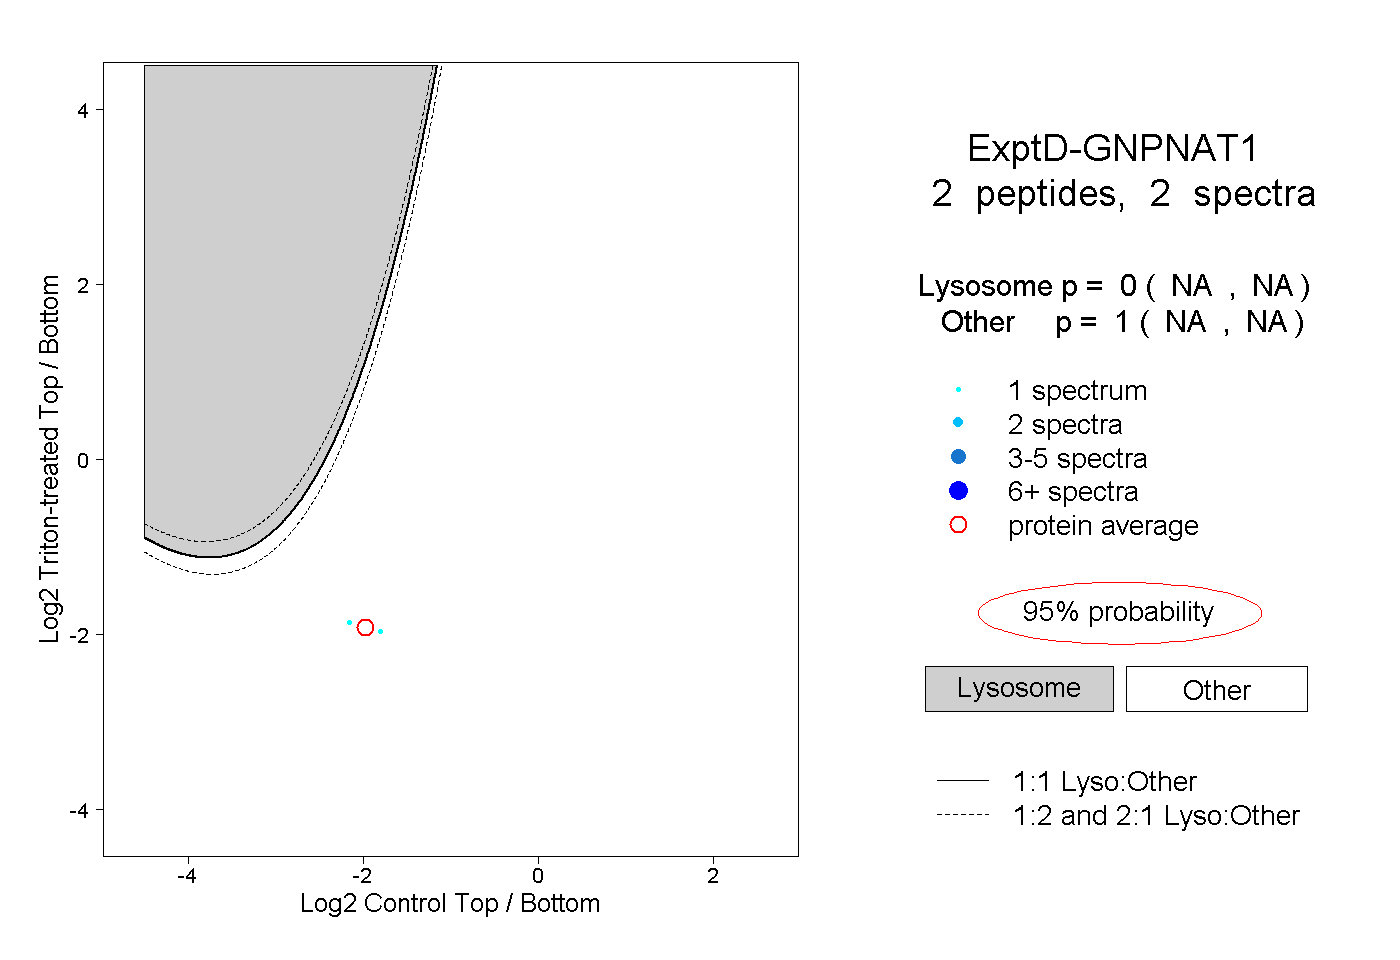 |
0.000 NA | NA |
1.000 NA | NA |