 6
6peptides
spectra
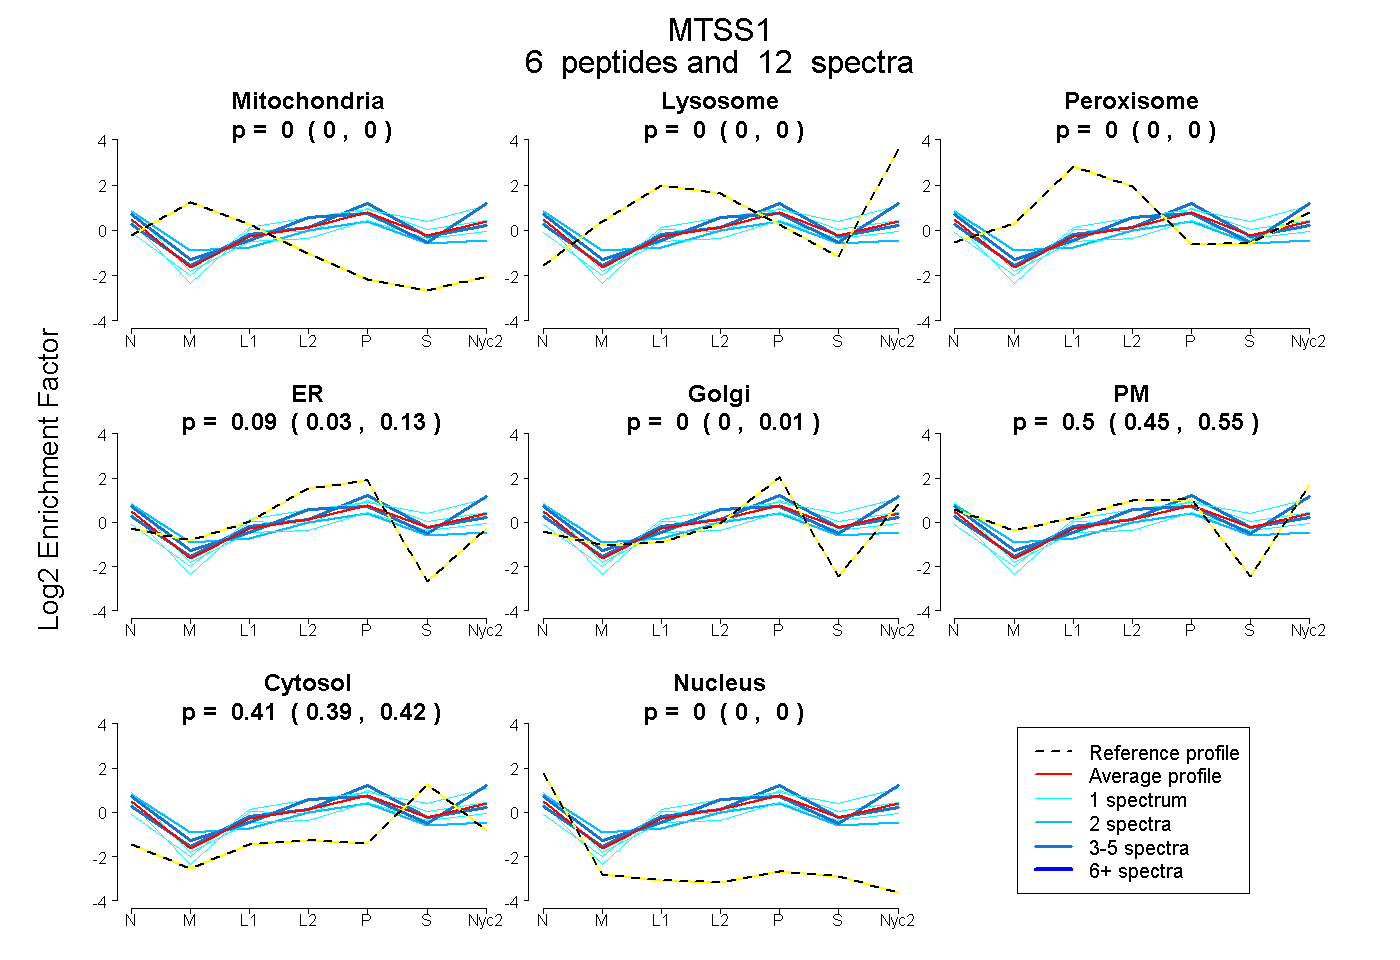
0.000 | 0.000
0.000 | 0.000
0.000 | 0.001
0.034 | 0.133
0.000 | 0.012
0.448 | 0.546
0.393 | 0.419
0.000 | 0.000
2peptides
spectra
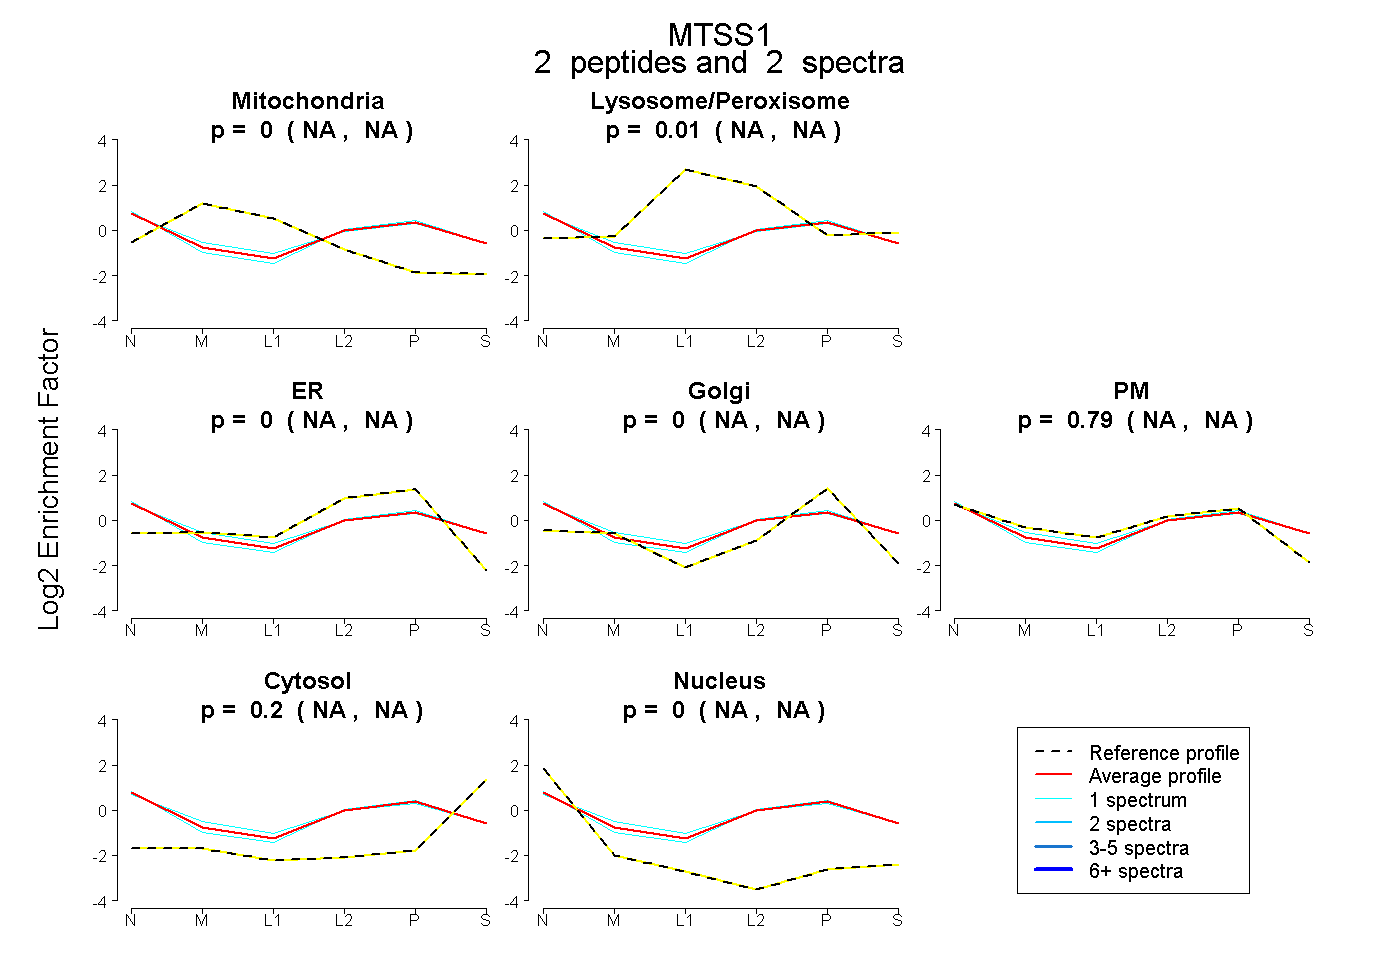
NA | NA
NA | NA
NA | NA
NA | NA
NA | NA
NA | NA
NA | NA
9peptides
spectra
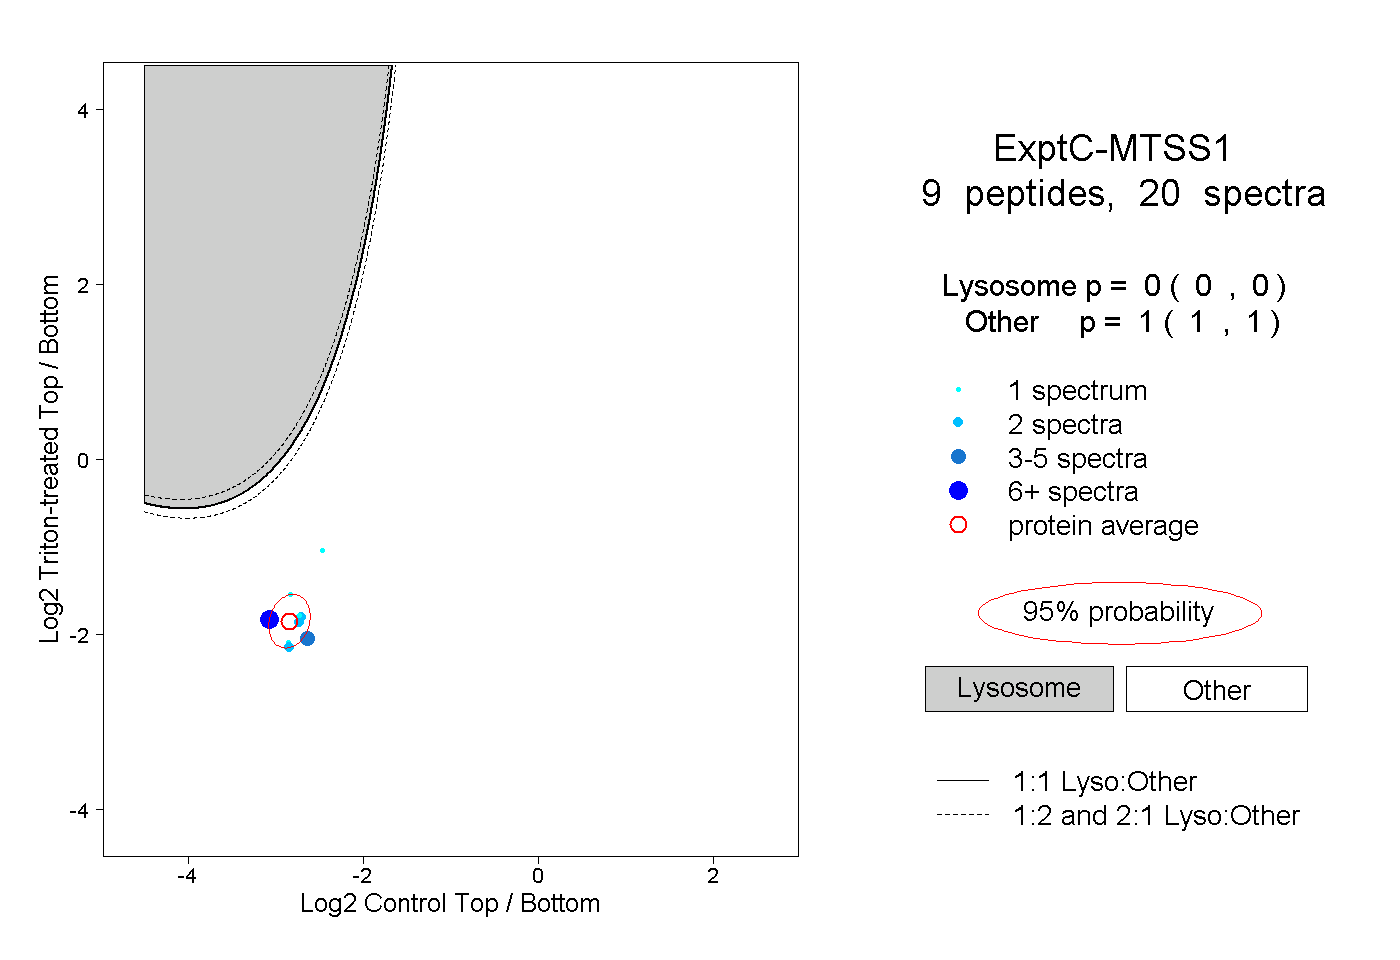
0.000 | 0.000
1.000 | 1.000
1peptide
spectra
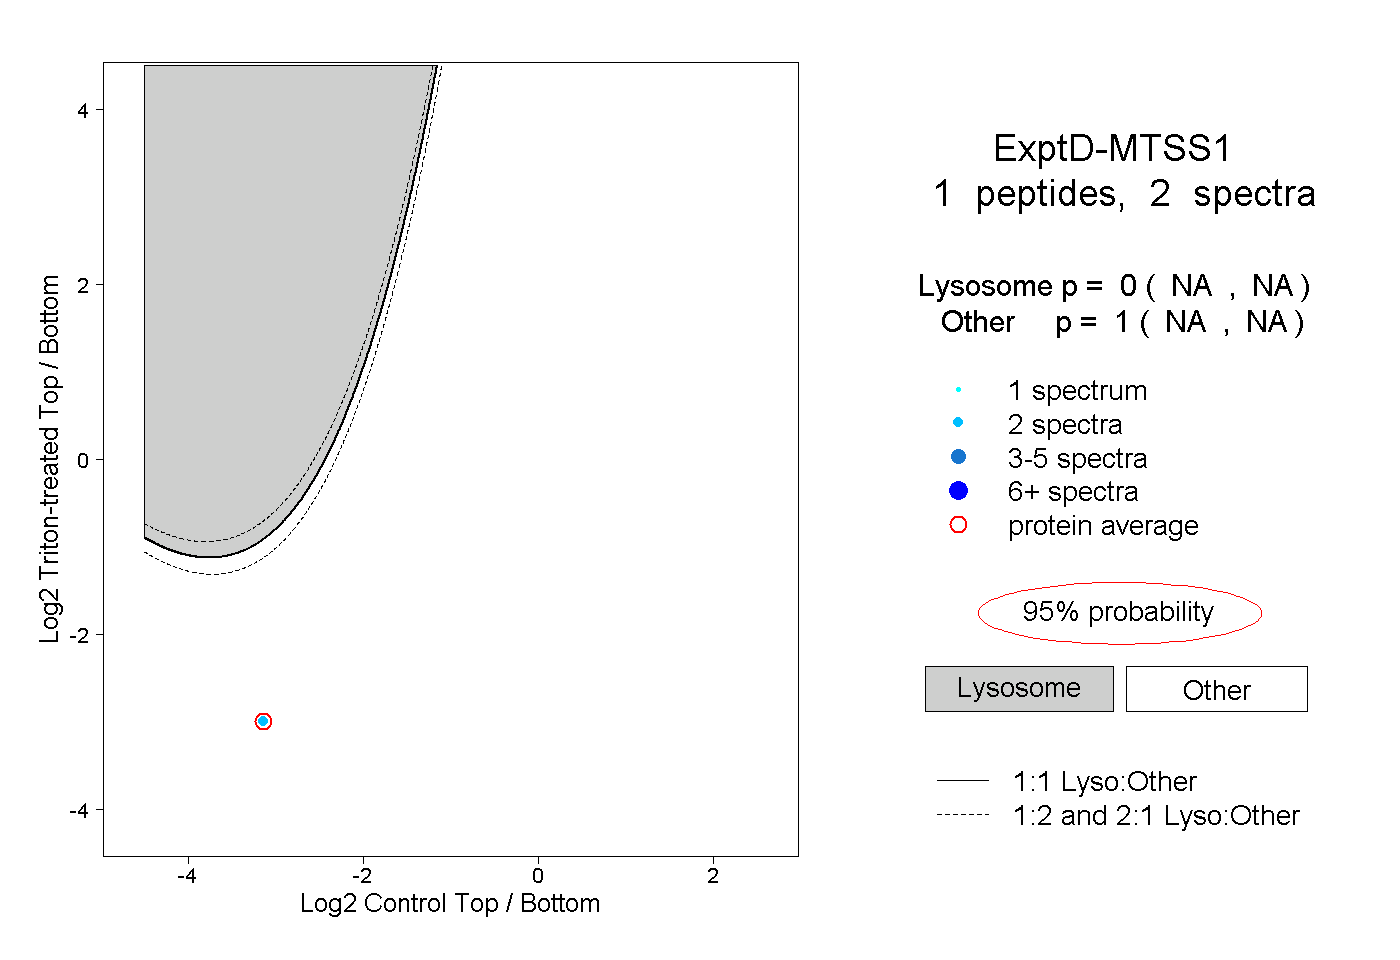
NA | NA
NA | NA