 7
7peptides
spectra
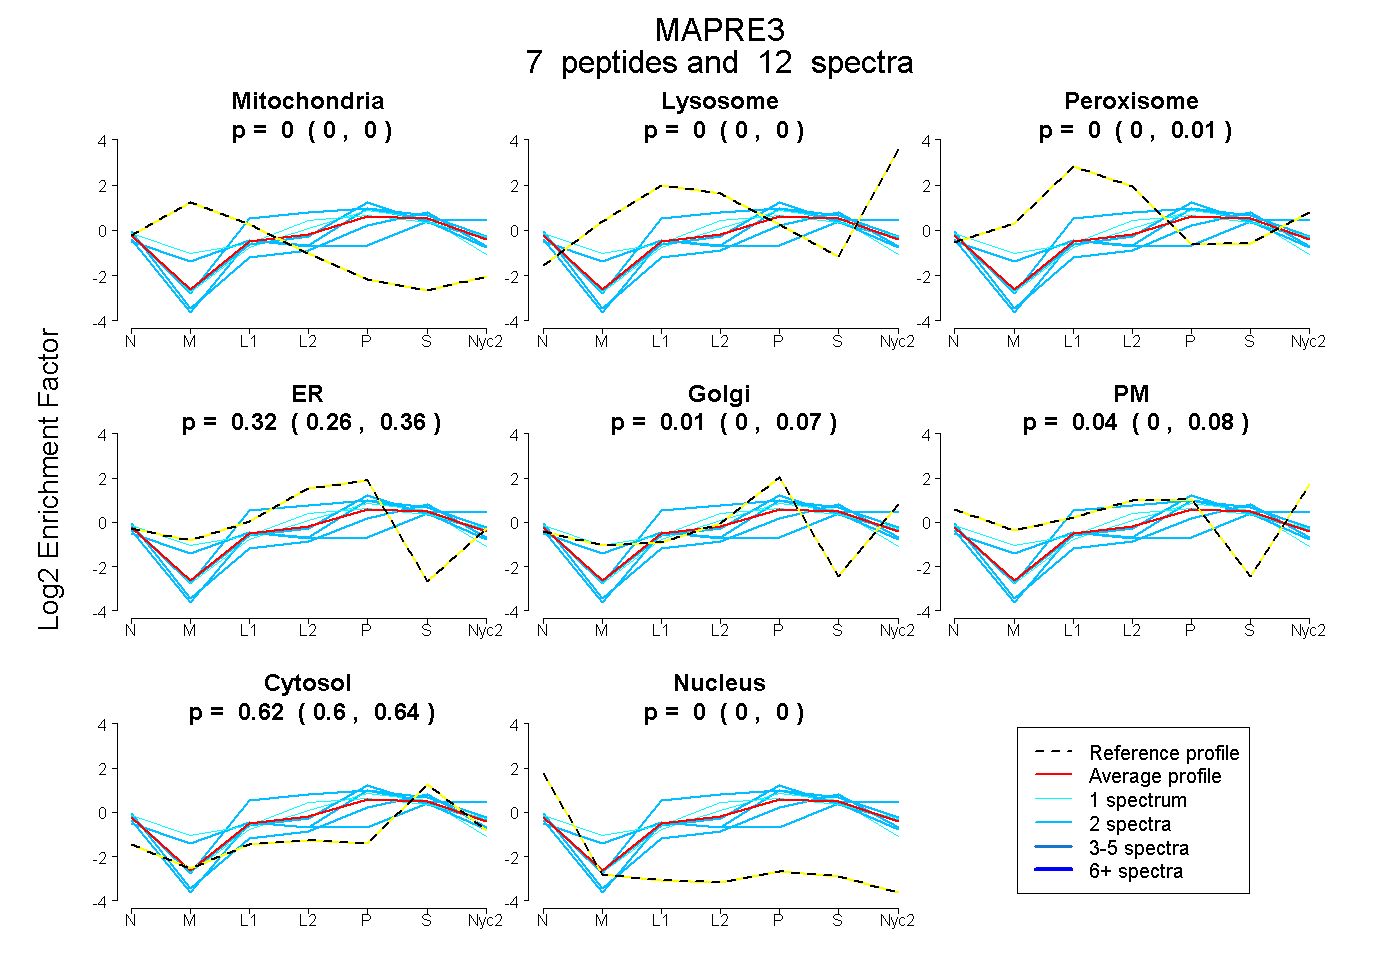
0.000 | 0.000
0.000 | 0.000
0.000 | 0.007
0.262 | 0.363
0.000 | 0.071
0.000 | 0.082
0.599 | 0.637
0.000 | 0.000
2peptides
spectra
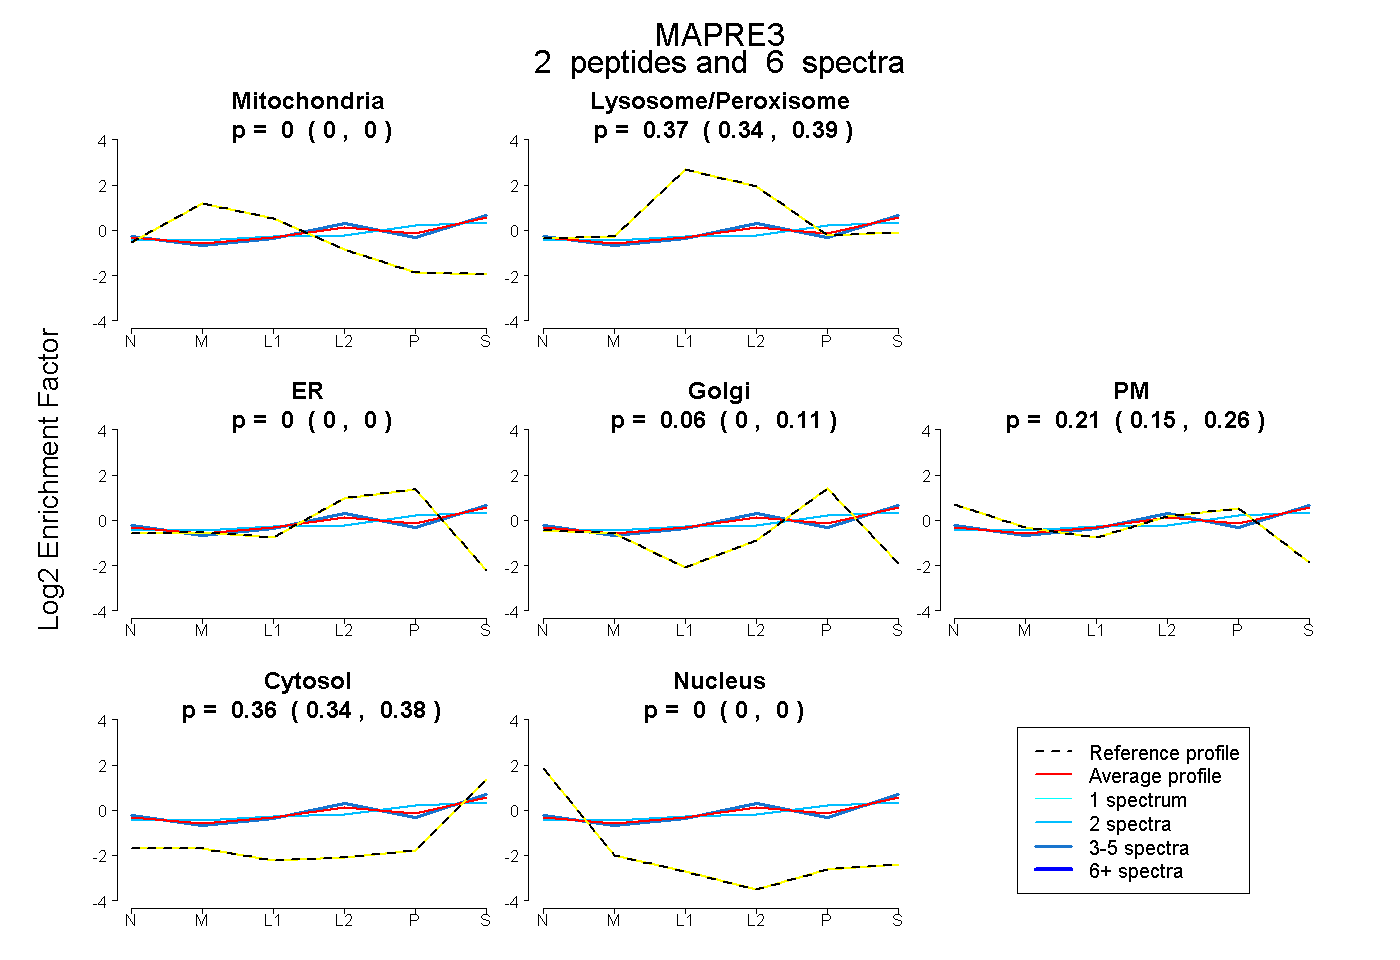
0.000 | 0.000
0.341 | 0.392
0.000 | 0.000
0.000 | 0.109
0.145 | 0.263
0.338 | 0.382
0.000 | 0.000
5peptides
spectra
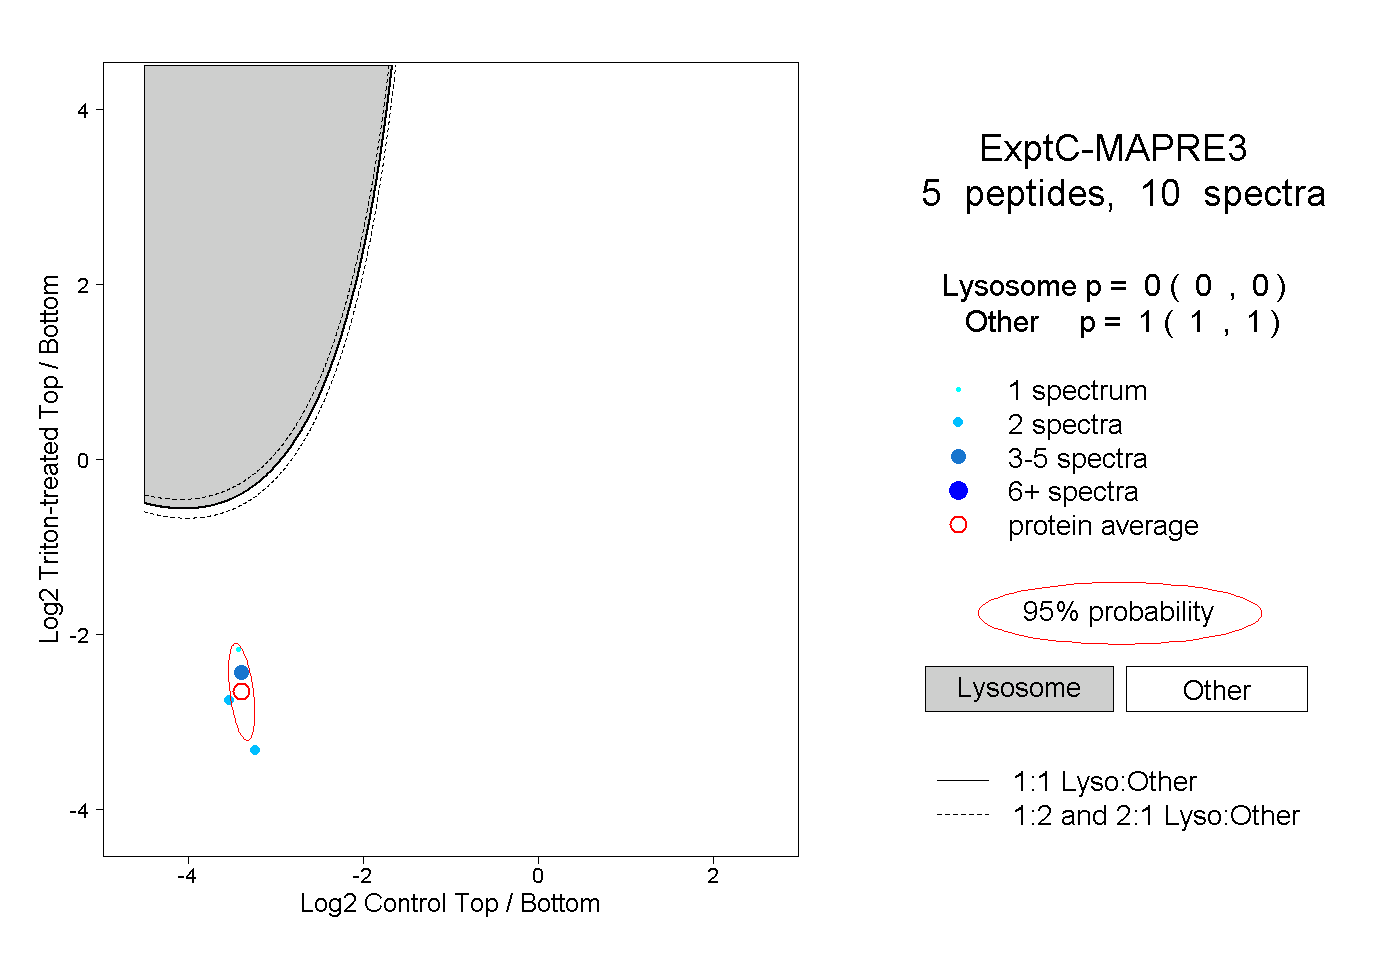
0.000 | 0.000
1.000 | 1.000
1peptide
spectra
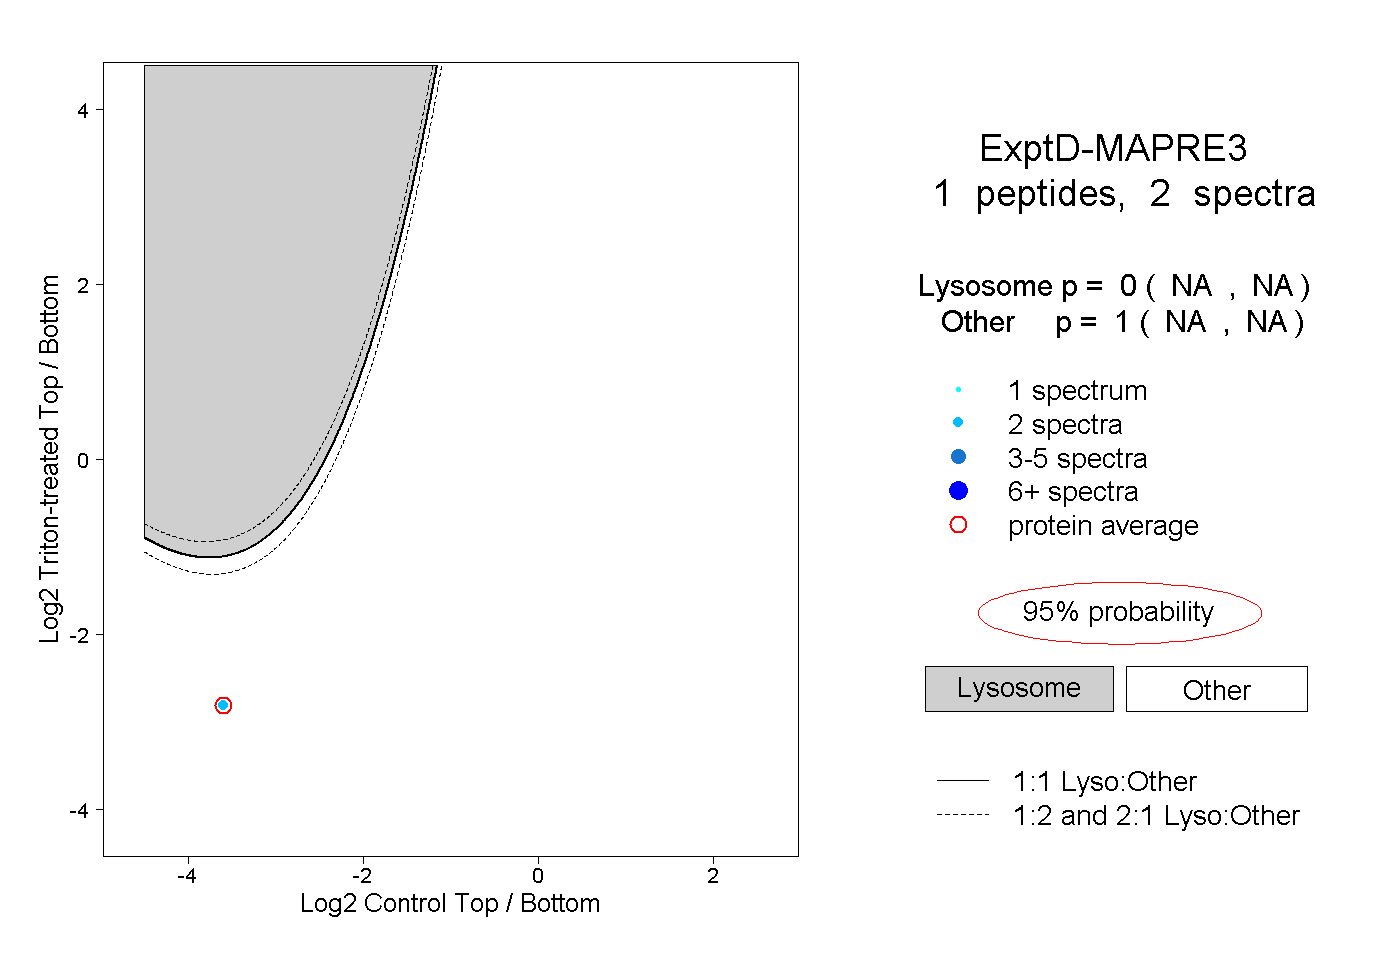
NA | NA
NA | NA