MAPRE3
[ENSRNOP00000011877]
Main page
| | | Plot |
Mito |
Lyso |
|
Perox |
ER |
Golgi |
PM |
Cytosol |
Nucleus |
|
| Expt A |
 7
7
peptides |
12
spectra |
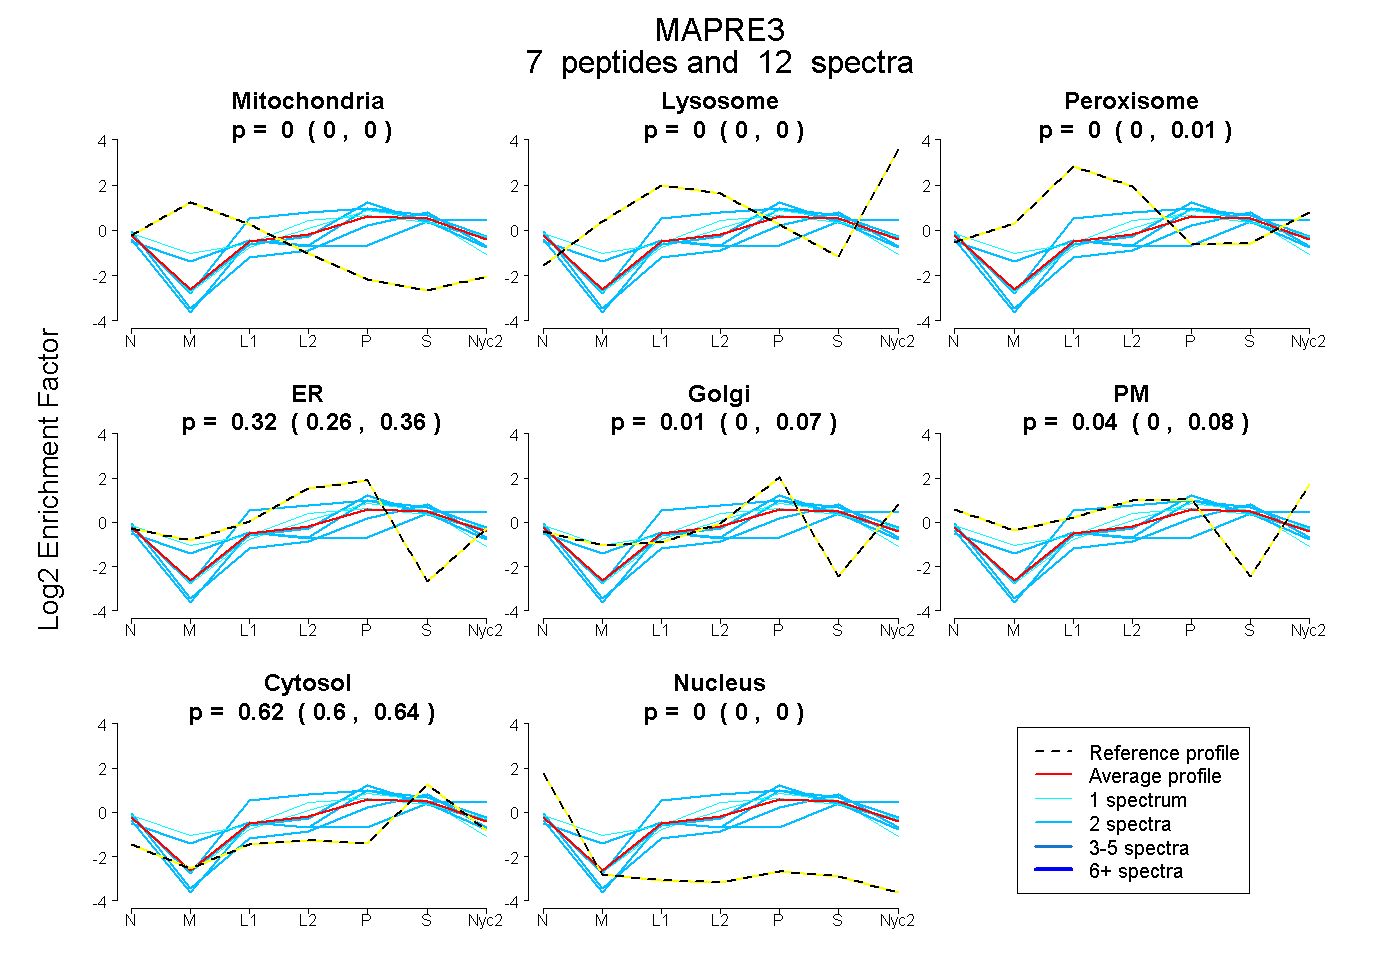 |
0.000
0.000 | 0.000 |
0.000
0.000 | 0.000 |
|
0.000
0.000 | 0.007 |
0.323
0.262 | 0.363 |
0.013
0.000 | 0.071 |
0.044
0.000 | 0.082 |
0.621
0.599 | 0.637 |
0.000
0.000 | 0.000 |
|
| | | Plot |
Mito |
|
Lyso or Perox |
|
ER |
Golgi |
PM |
Cytosol |
Nucleus |
|
| Expt B |
2
peptides |
6
spectra |
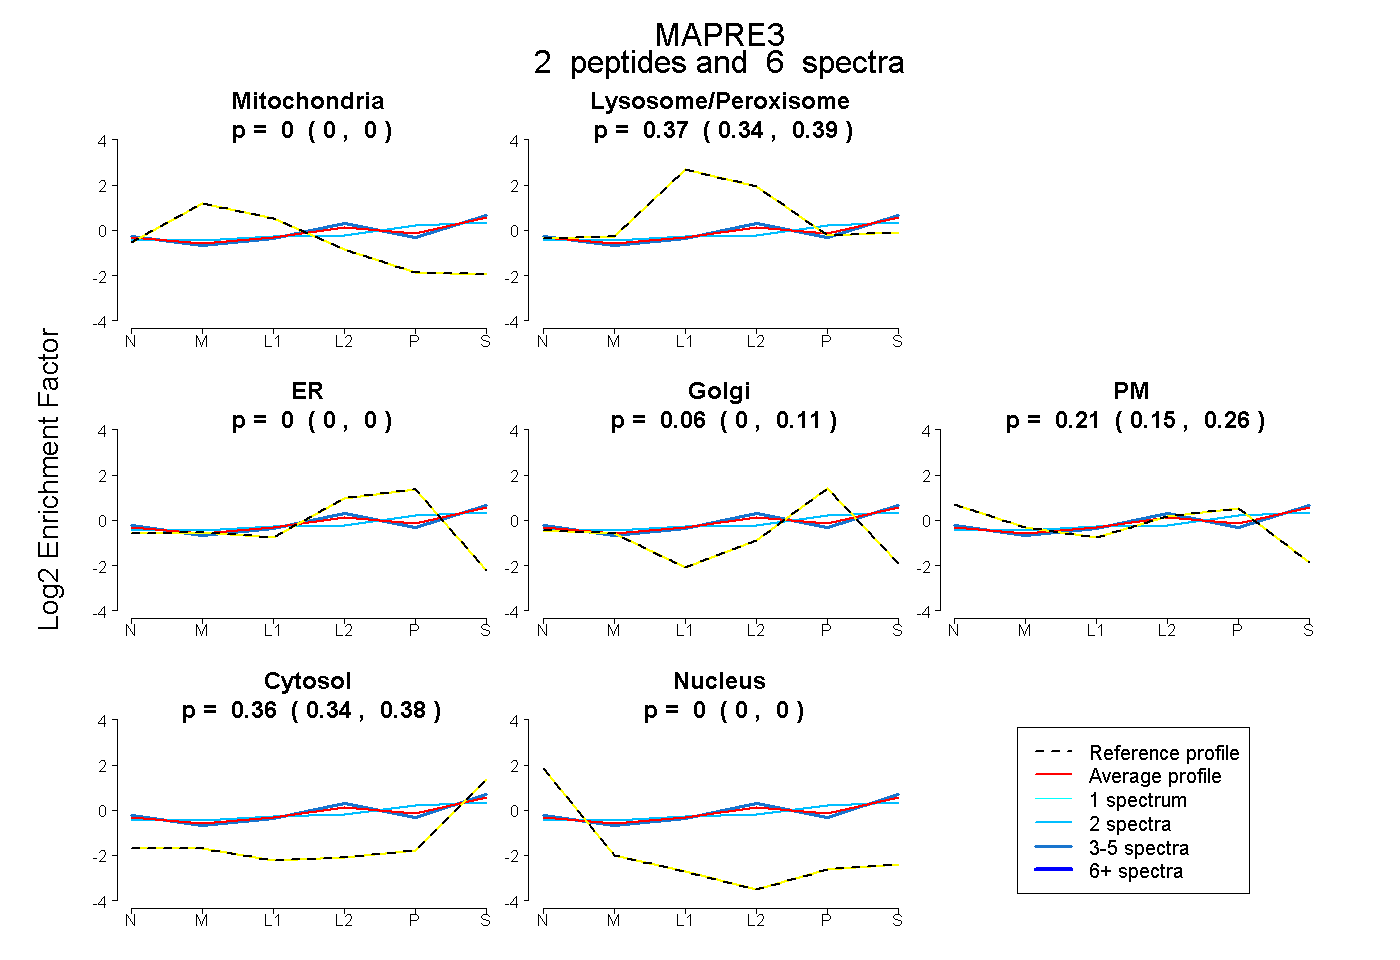 |
0.000
0.000 | 0.000 |
|
0.369
0.341 | 0.392 |
|
0.000
0.000 | 0.000 |
0.056
0.000 | 0.109 |
0.213
0.145 | 0.263 |
0.363
0.338 | 0.382 |
0.000
0.000 | 0.000 |
|
| 4 spectra, LEHEYIHNFK |
0.000 |
|
0.377 |
|
0.000 |
0.000 |
0.239 |
0.385 |
0.000 |
|
| 2 spectra, LIGTAVPQR |
0.000 |
|
0.390 |
|
0.000 |
0.291 |
0.022 |
0.297 |
0.000 |
|
| | | Plot |
|
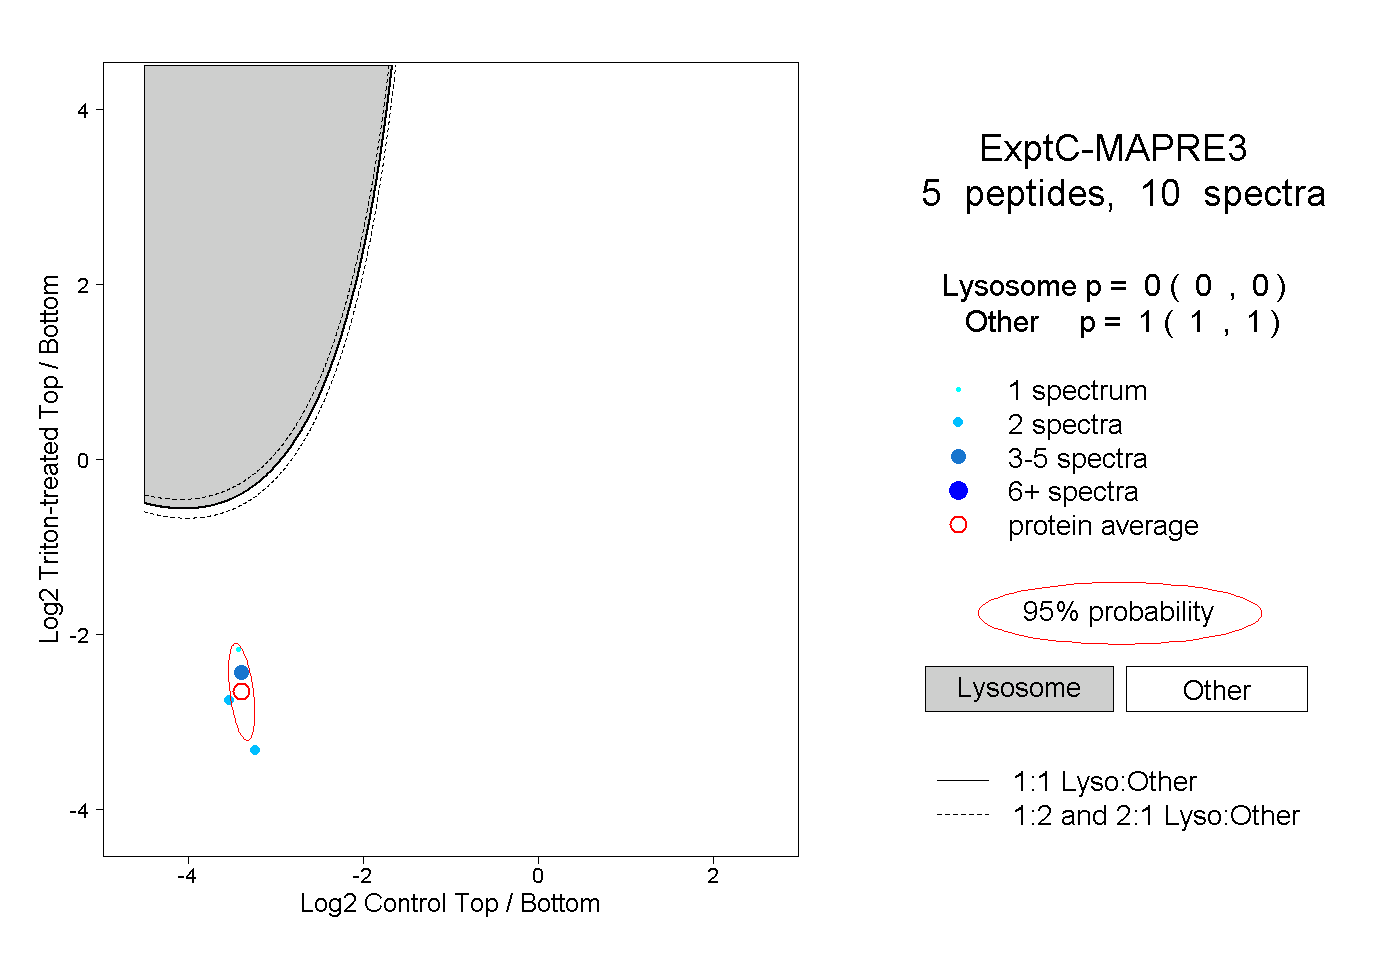
Lyso |
|
|
|
|
|
|
|
Other |
| Expt C |
5
peptides |
10
spectra |
 |
|
0.000
0.000 | 0.000 |
|
|
|
|
|
|
|
1.000
1.000 | 1.000 |
| | | Plot |
|
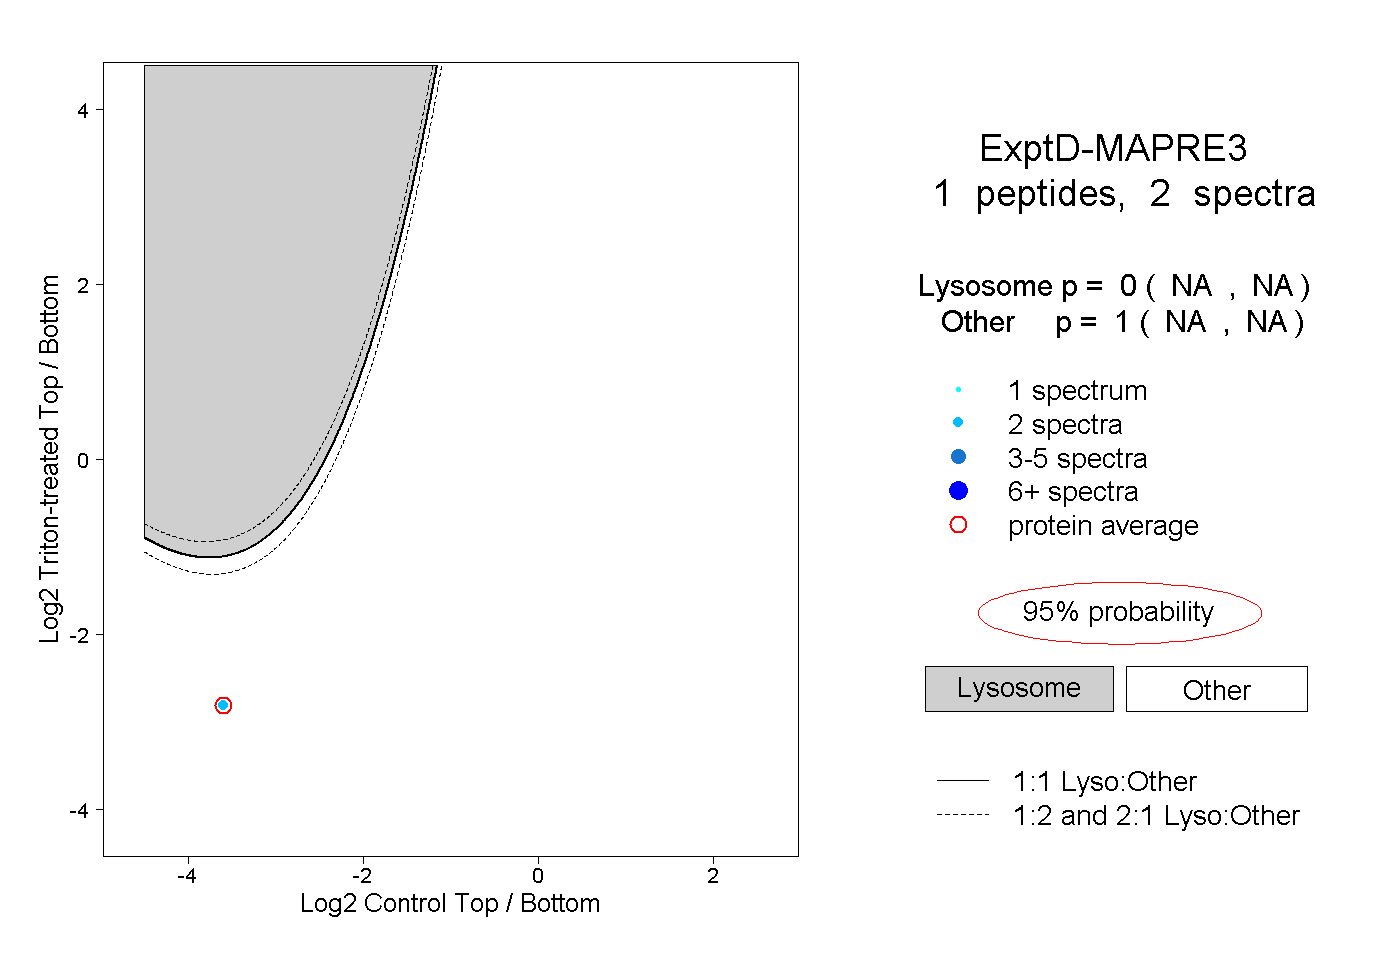
Lyso |
|
|
|
|
|
|
|
Other |
| Expt D |
1
peptide |
2
spectra |
 |
|
0.000
NA | NA |
|
|
|
|
|
|
|
1.000
NA | NA |