 3
3peptides
spectra
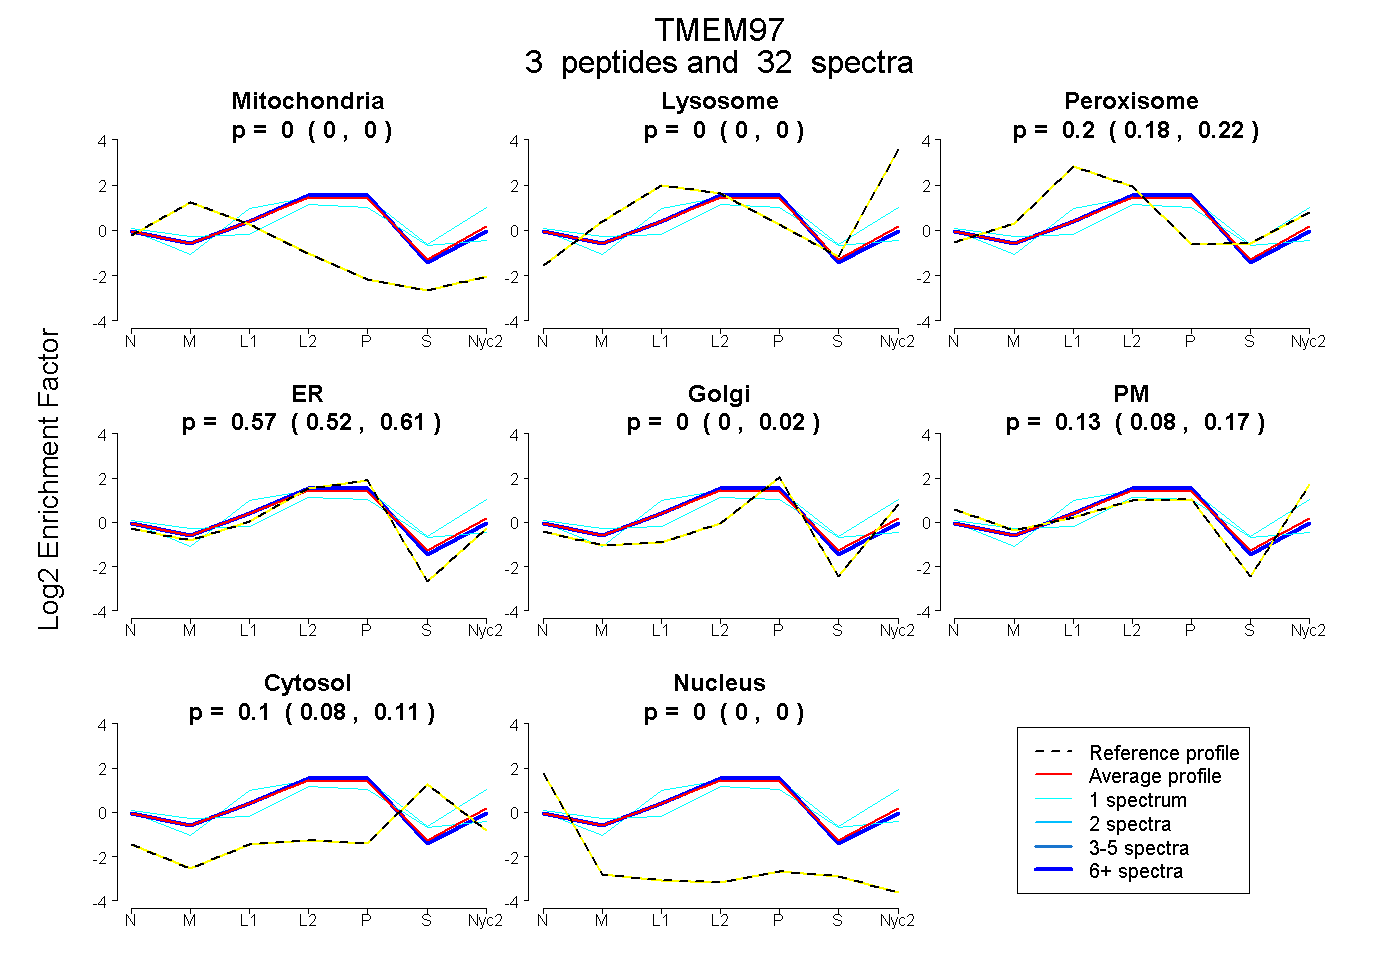
0.000 | 0.000
0.000 | 0.001
0.176 | 0.223
0.521 | 0.613
0.000 | 0.022
0.075 | 0.170
0.081 | 0.107
0.000 | 0.000
1peptide
spectra
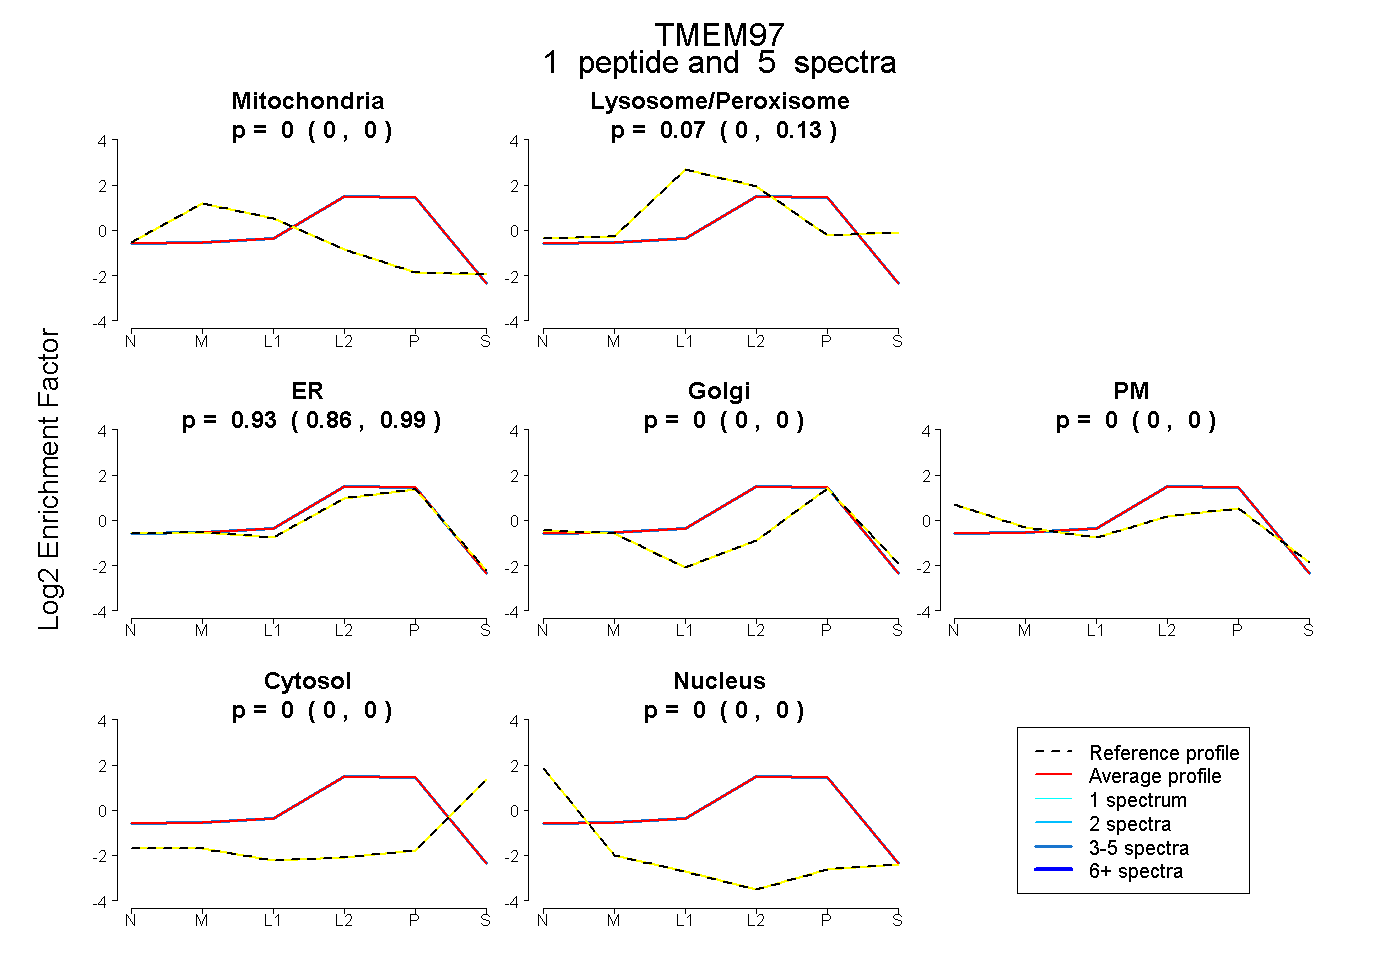
0.000 | 0.000
0.001 | 0.127
0.862 | 0.987
0.000 | 0.000
0.000 | 0.000
0.000 | 0.000
0.000 | 0.000
1peptide
spectra
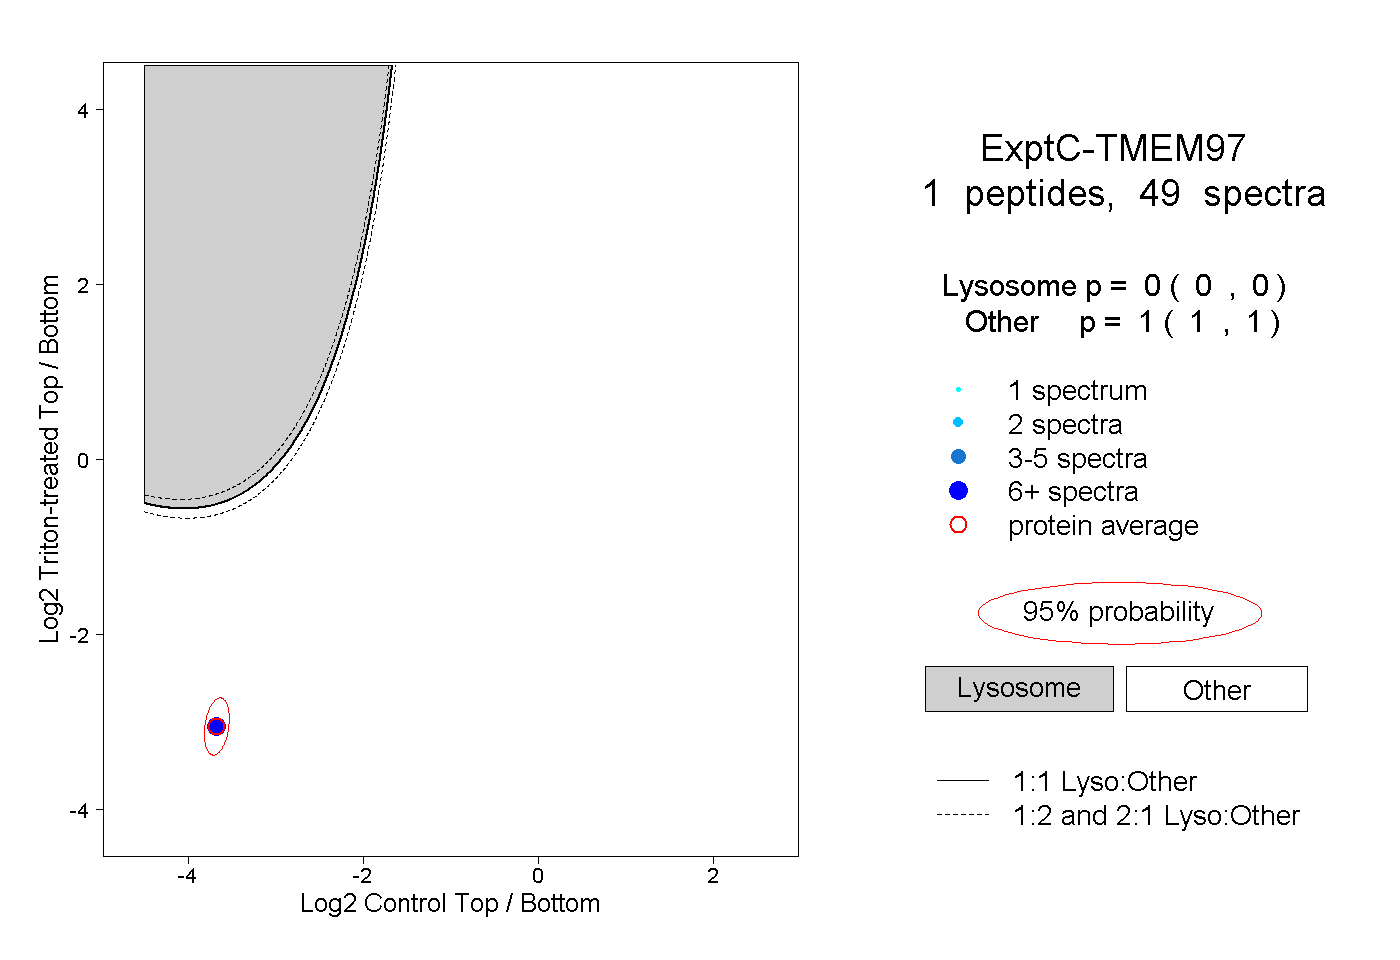
0.000 | 0.000
1.000 | 1.000
1peptide
spectra
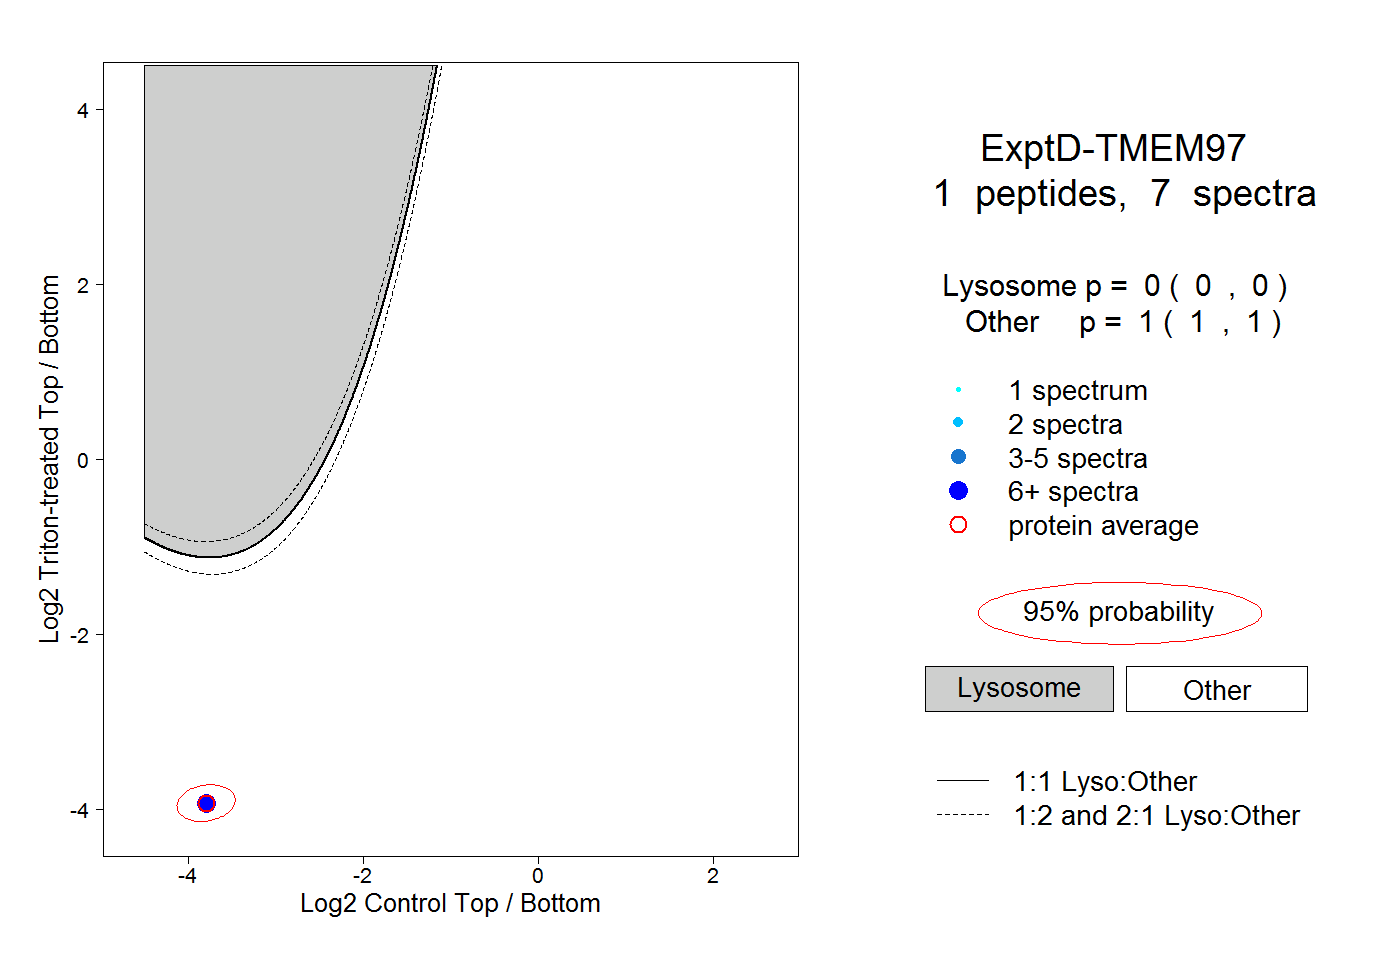
0.000 | 0.000
1.000 | 1.000