 3
3peptides
spectra
0.000 | 0.000
0.000 | 0.001
0.176 | 0.223
0.521 | 0.613
0.000 | 0.022
0.075 | 0.170
0.081 | 0.107
0.000 | 0.000
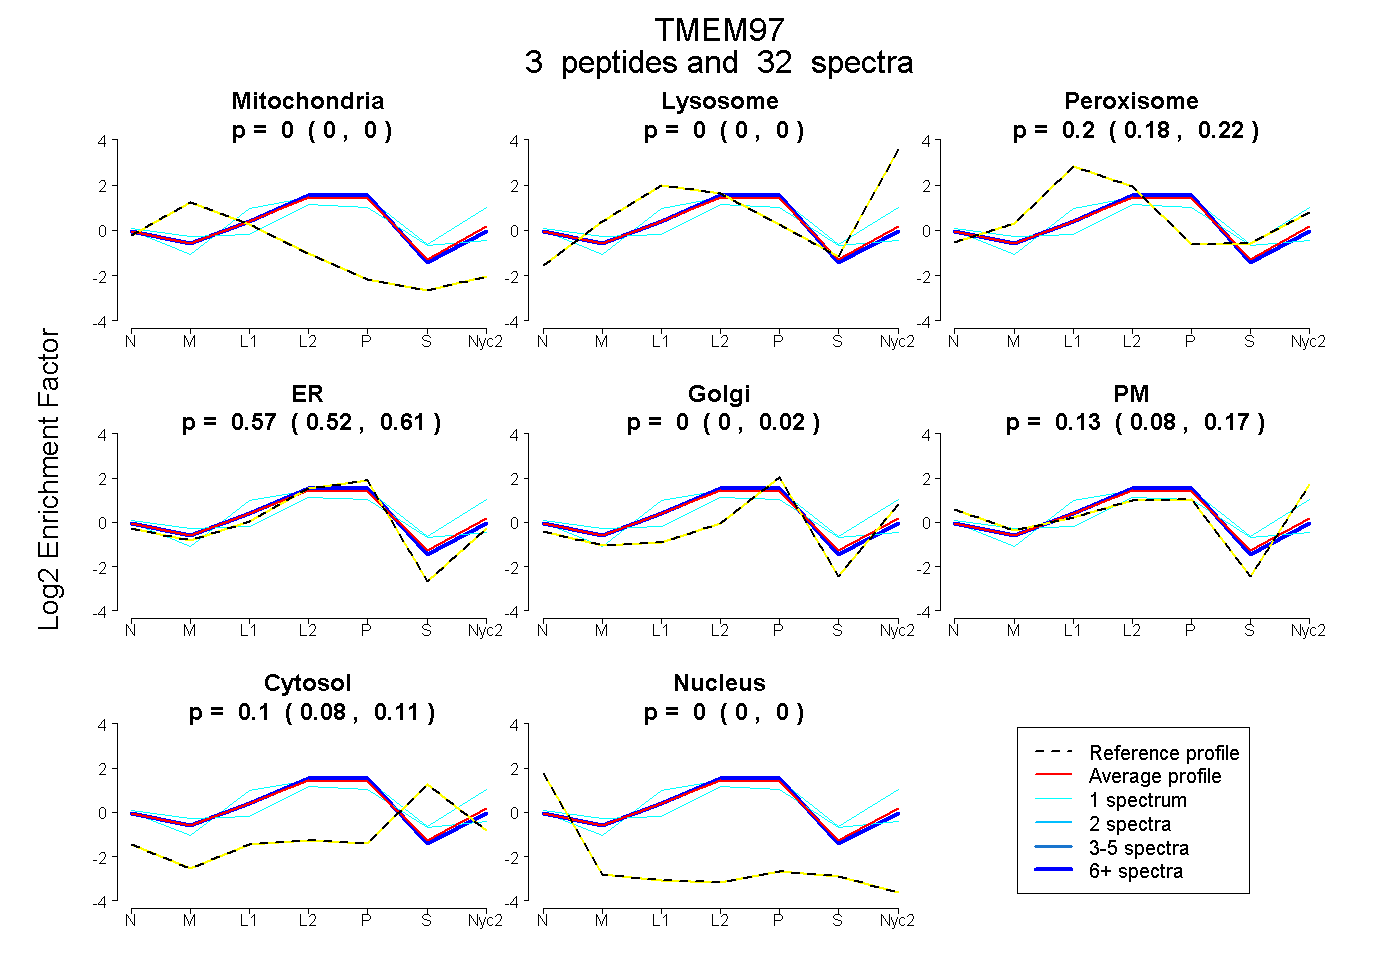
| Plot | Mito | Lyso | Perox | ER | Golgi | PM | Cytosol | Nucleus | |||||
| Expt A |
3 peptides |
32 spectra |
|
0.000 0.000 | 0.000 |
0.000 0.000 | 0.001 |
0.201 0.176 | 0.223 |
0.573 0.521 | 0.613 |
0.000 0.000 | 0.022 |
0.129 0.075 | 0.170 |
0.096 0.081 | 0.107 |
0.000 0.000 | 0.000 |
| 1 spectrum, MGAVTAR | 0.008 | 0.000 | 0.172 | 0.559 | 0.000 | 0.039 | 0.222 | 0.000 | ||
| 30 spectra, GQRPENFR | 0.000 | 0.000 | 0.192 | 0.696 | 0.000 | 0.041 | 0.072 | 0.000 | ||
| 1 spectrum, DPLMQEPPVWFK | 0.000 | 0.152 | 0.210 | 0.345 | 0.030 | 0.156 | 0.109 | 0.000 |
| Plot | Mito | Lyso or Perox | ER | Golgi | PM | Cytosol | Nucleus | ||||||
| Expt B |
1 peptide |
5 spectra |
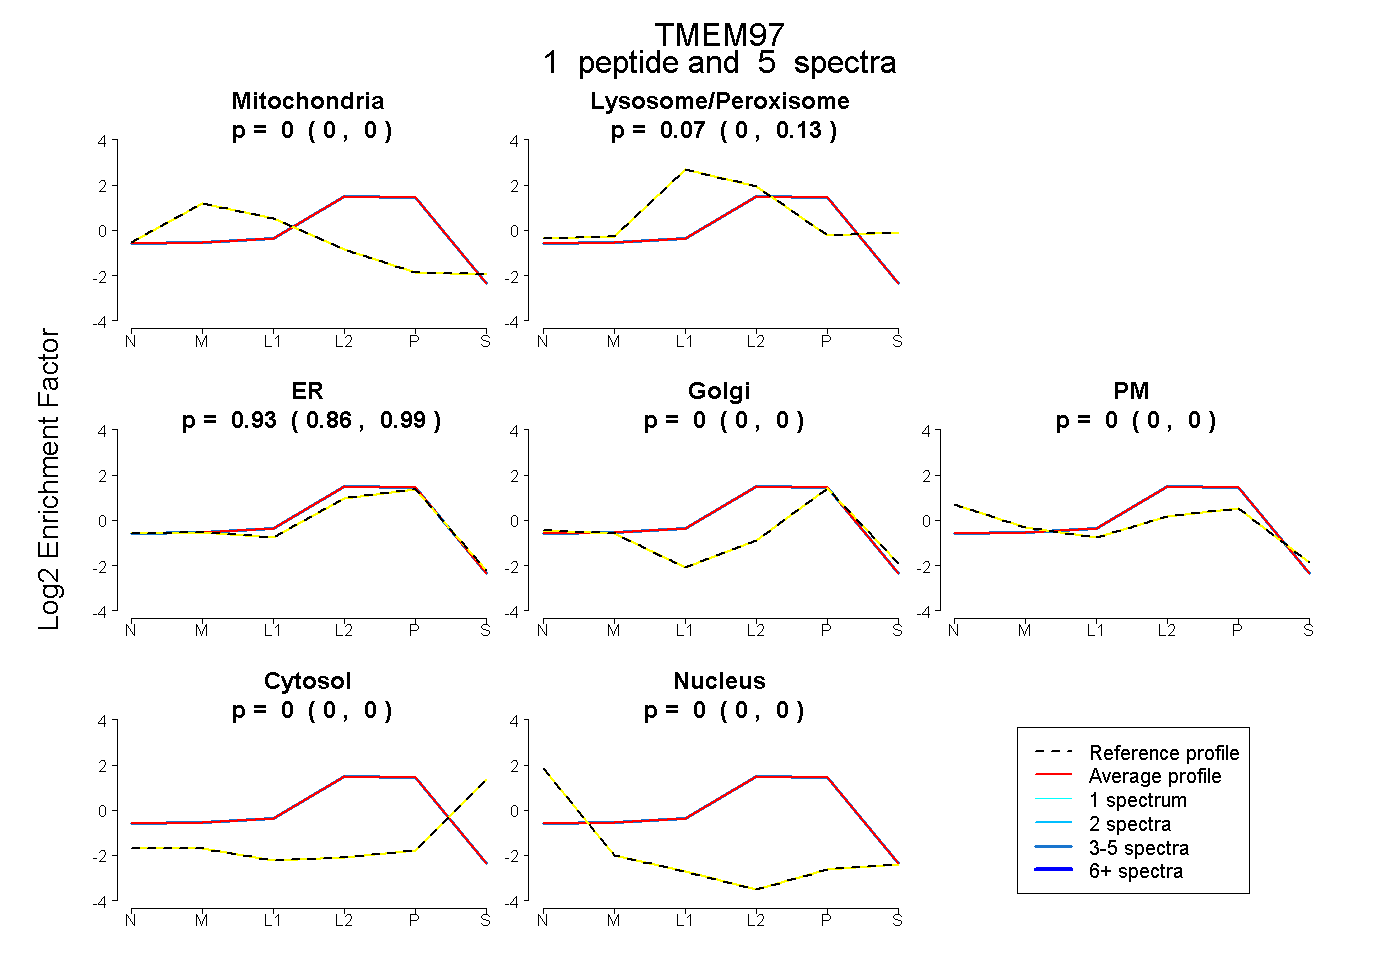 |
0.000 0.000 | 0.000 |
0.069 0.001 | 0.127 |
0.931 0.862 | 0.987 |
0.000 0.000 | 0.000 |
0.000 0.000 | 0.000 |
0.000 0.000 | 0.000 |
0.000 0.000 | 0.000 |
|||
| Plot | Lyso | Other | |||||||||||
| Expt C |
1 peptide |
49 spectra |
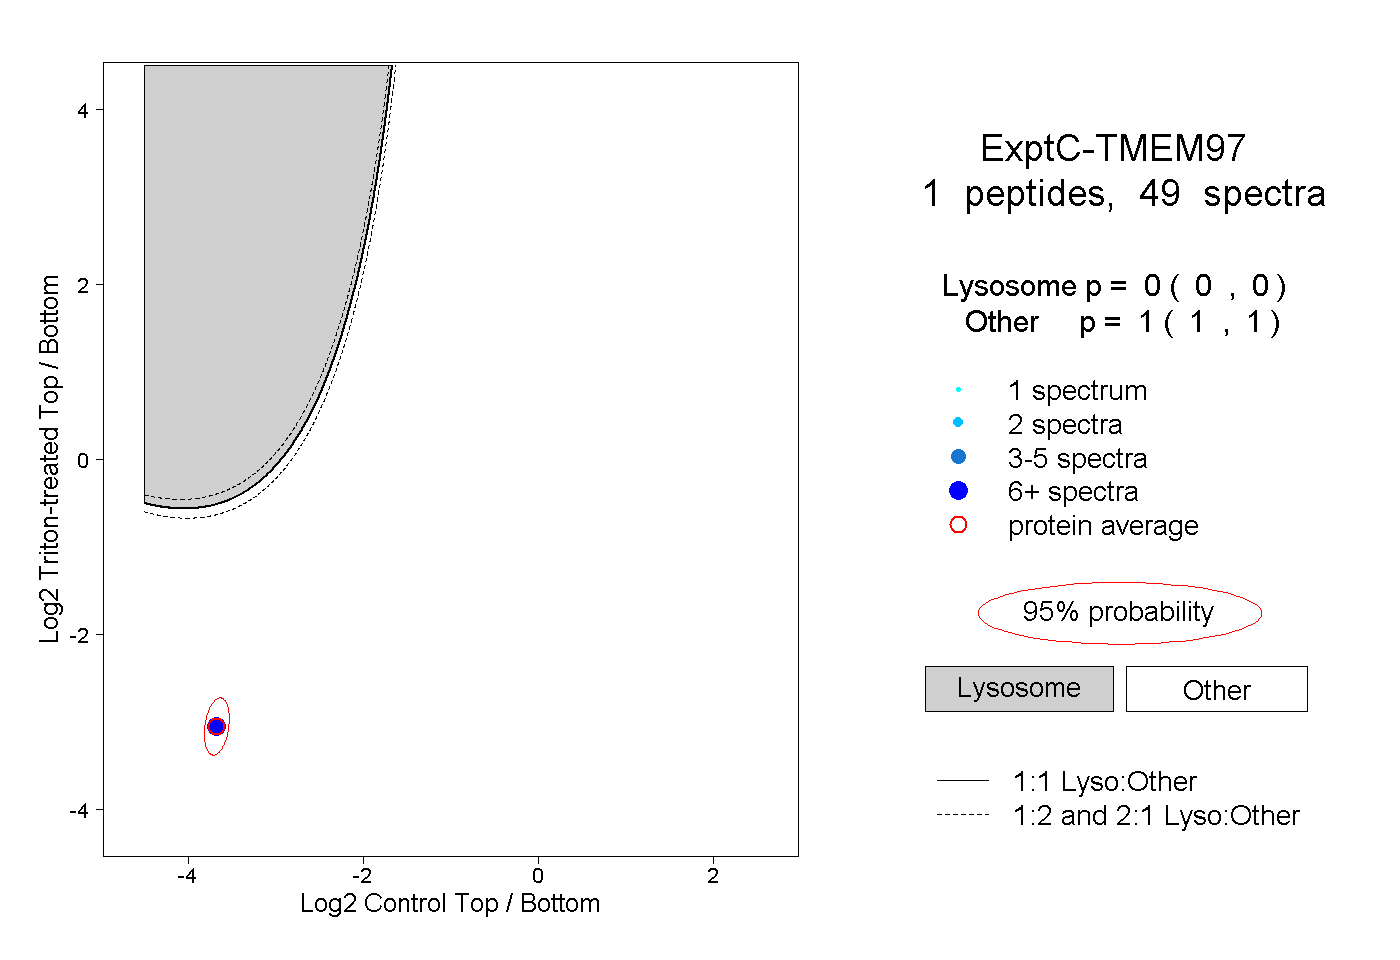 |
0.000 0.000 | 0.000 |
1.000 1.000 | 1.000 |
||||||||
| Plot | Lyso | Other | |||||||||||
| Expt D |
1 peptide |
7 spectra |
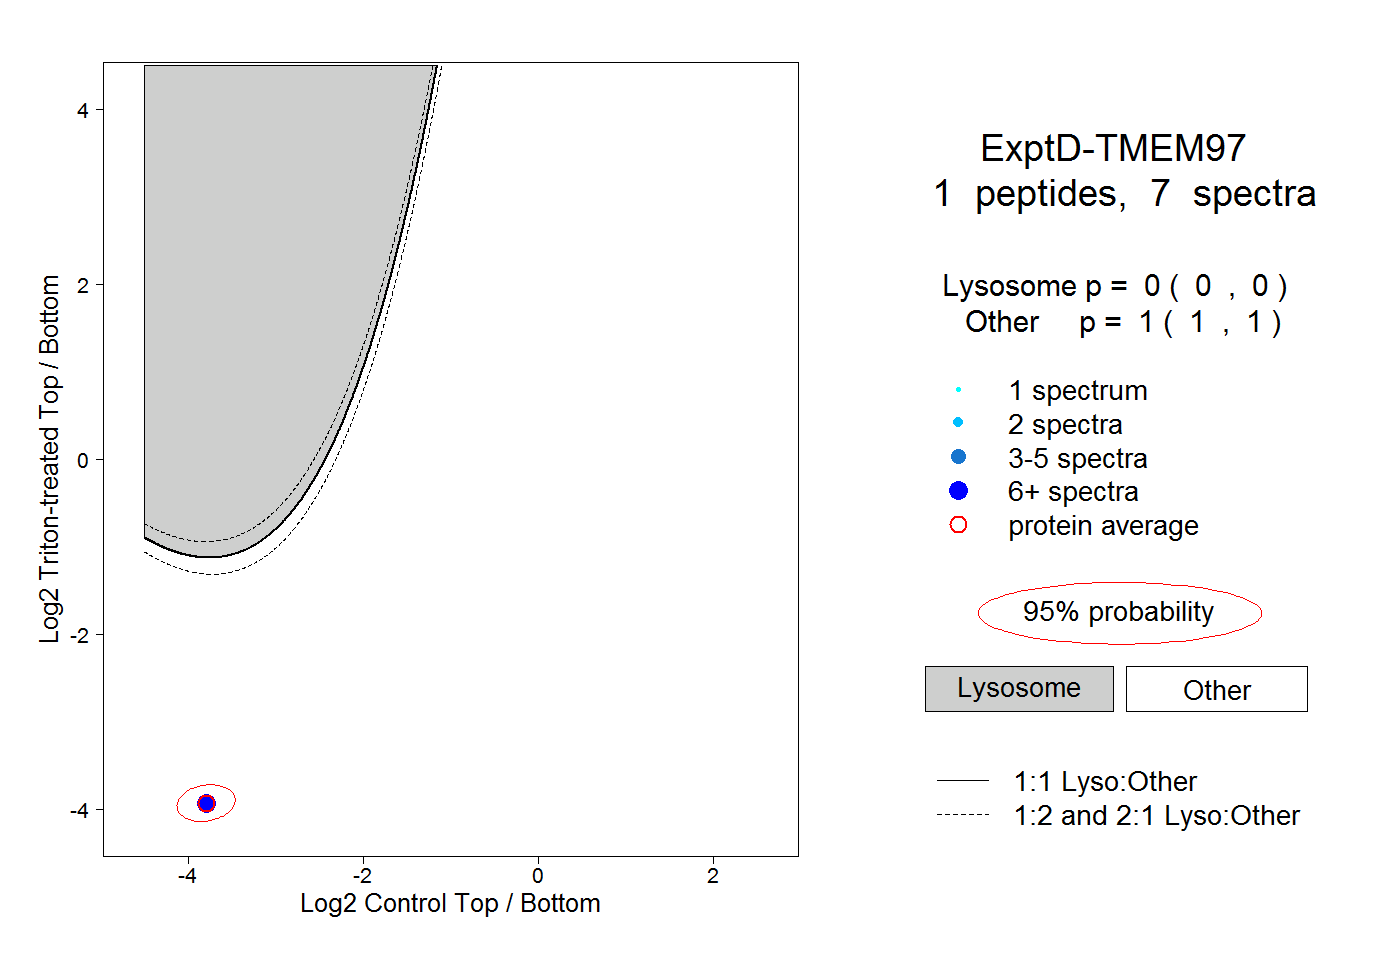 |
0.000 0.000 | 0.000 |
1.000 1.000 | 1.000 |