 13
13peptides
spectra
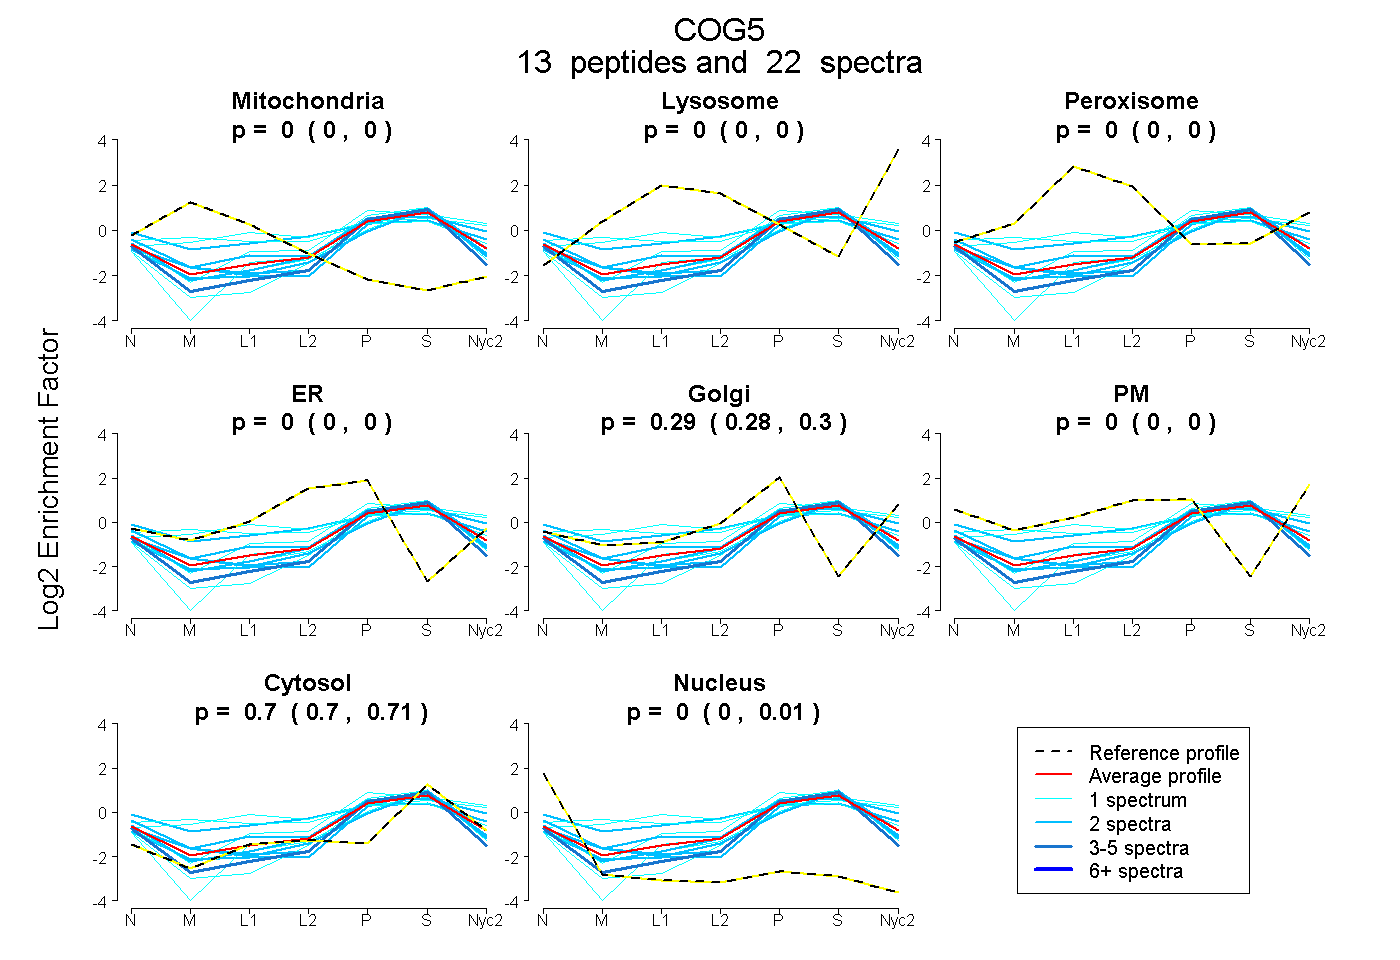
0.000 | 0.000
0.000 | 0.000
0.000 | 0.000
0.000 | 0.000
0.284 | 0.299
0.000 | 0.000
0.697 | 0.709
0.000 | 0.010
4peptides
spectra
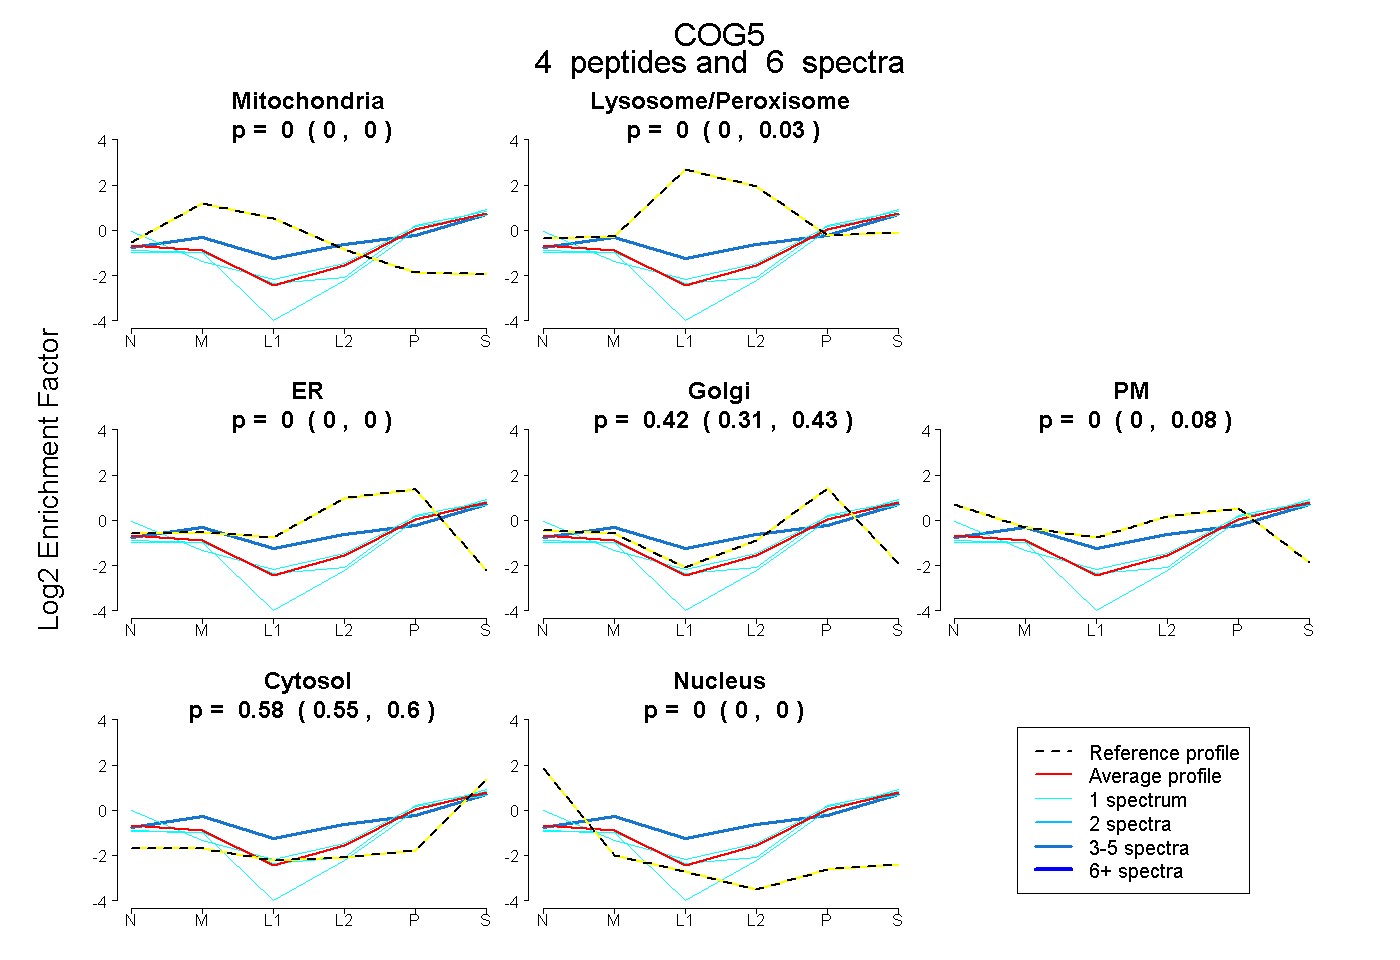
0.000 | 0.000
0.000 | 0.034
0.000 | 0.000
0.315 | 0.429
0.000 | 0.084
0.553 | 0.600
0.000 | 0.000
3peptides
spectra
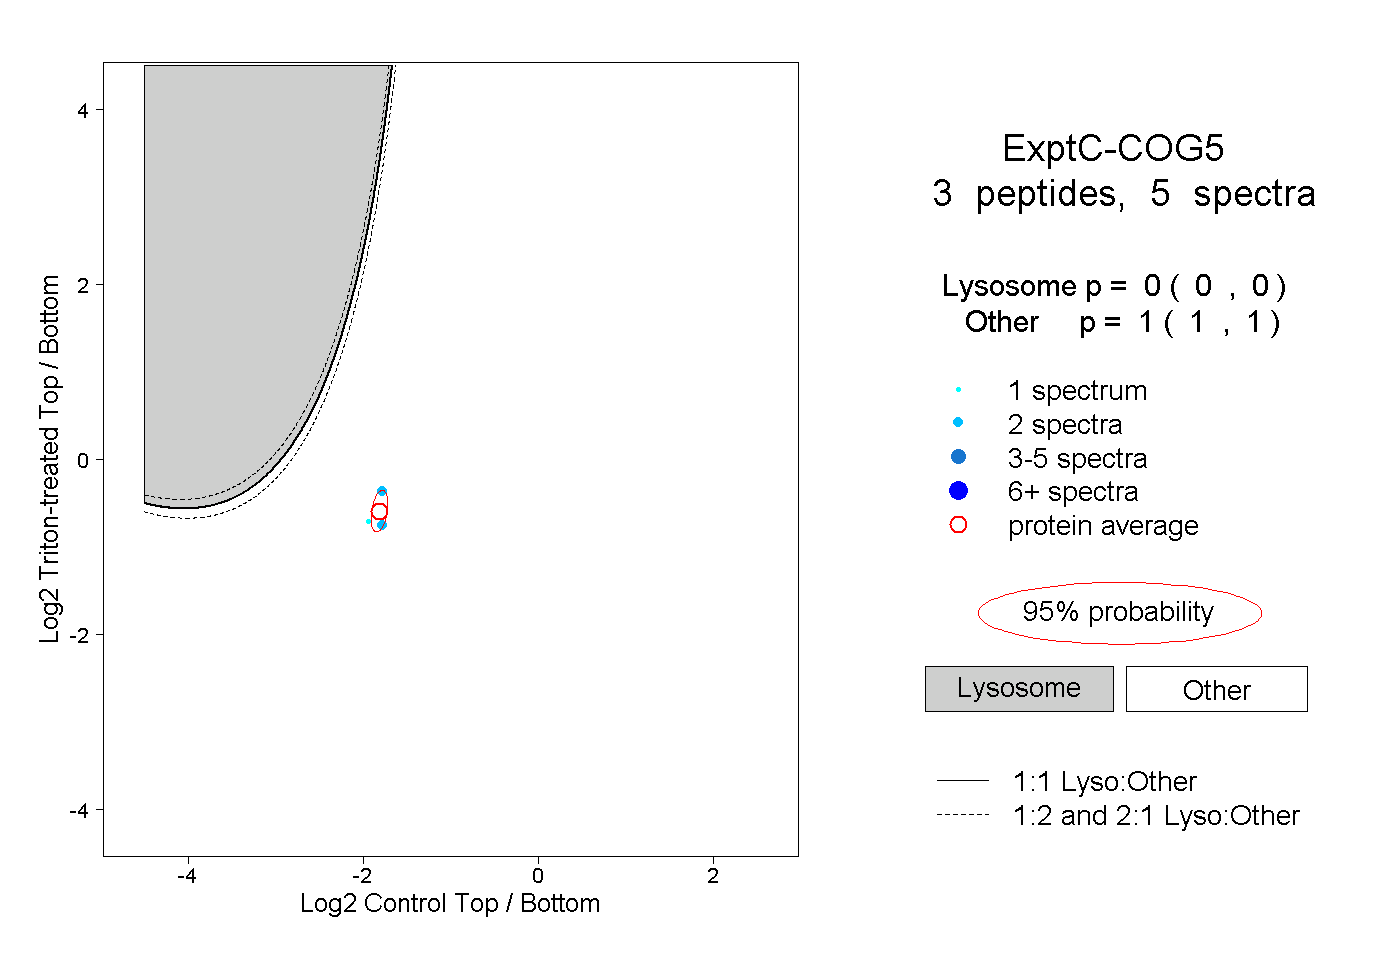
0.000 | 0.000
1.000 | 1.000
1peptide
spectrum
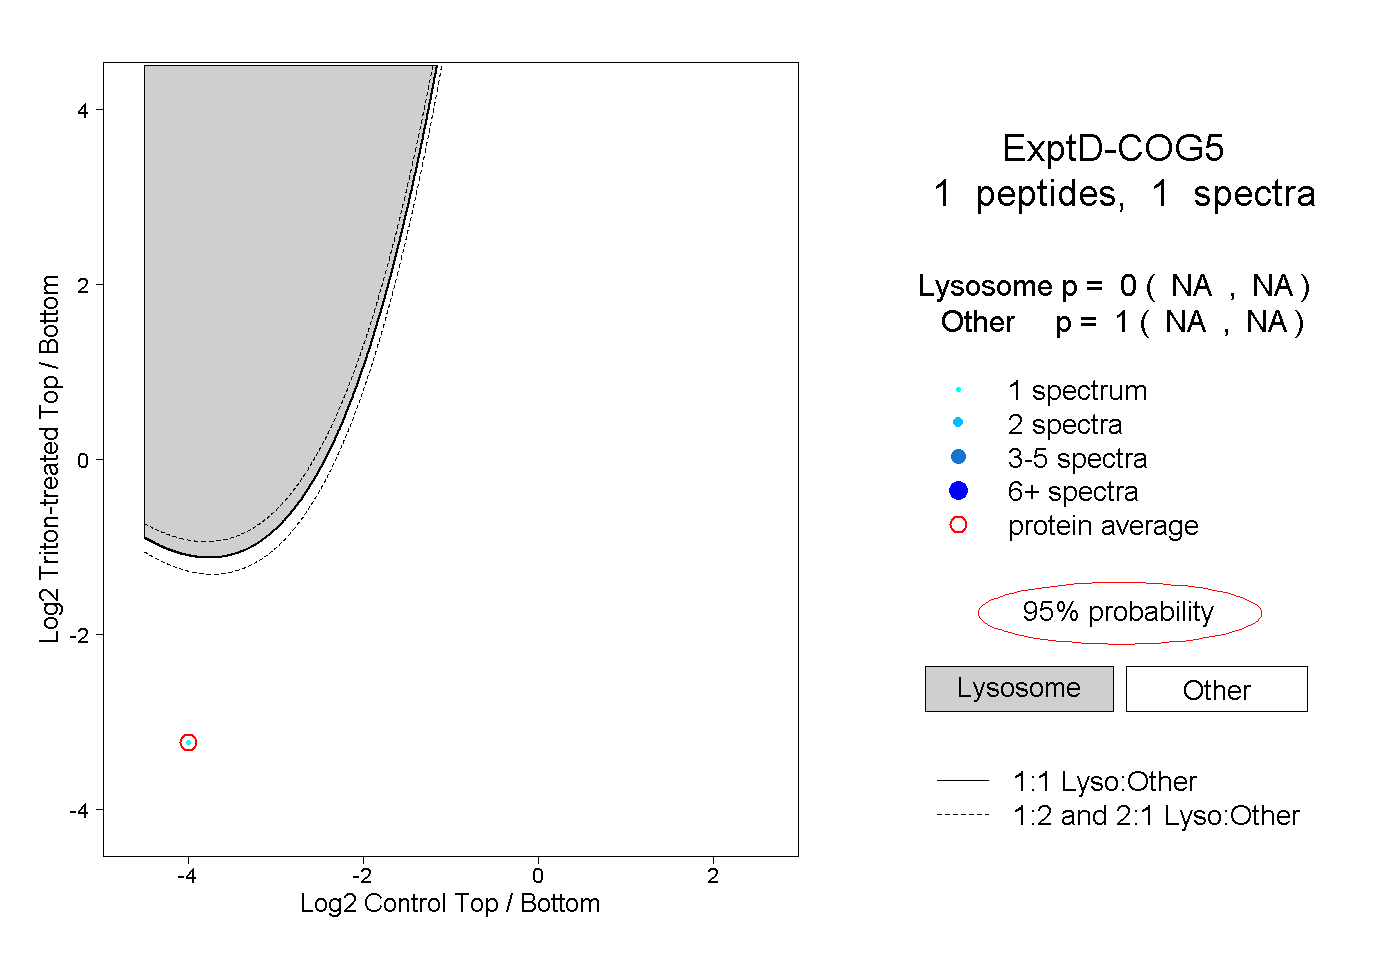
NA | NA
NA | NA