 13
13peptides
spectra
0.000 | 0.000
0.000 | 0.000
0.000 | 0.000
0.000 | 0.000
0.284 | 0.299
0.000 | 0.000
0.697 | 0.709
0.000 | 0.010
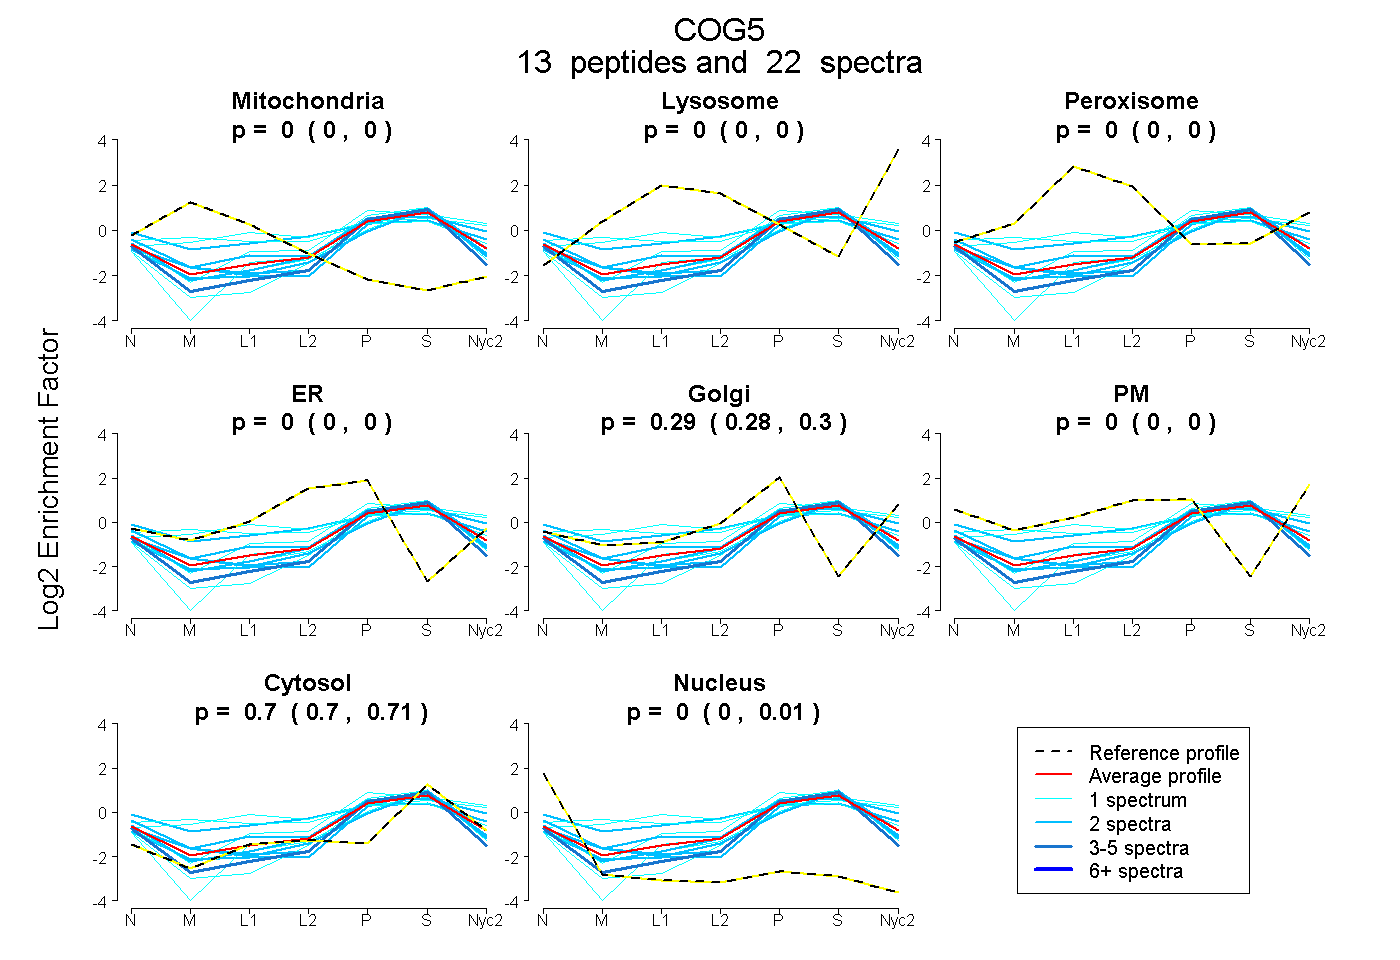
| Plot | Mito | Lyso | Perox | ER | Golgi | PM | Cytosol | Nucleus | |||||
| Expt A |
13 peptides |
22 spectra |
|
0.000 0.000 | 0.000 |
0.000 0.000 | 0.000 |
0.000 0.000 | 0.000 |
0.000 0.000 | 0.000 |
0.292 0.284 | 0.299 |
0.000 0.000 | 0.000 |
0.704 0.697 | 0.709 |
0.004 0.000 | 0.010 |
| 2 spectra, IGALQGAVDR | 0.000 | 0.000 | 0.000 | 0.000 | 0.251 | 0.000 | 0.698 | 0.051 | ||
| 1 spectrum, AMSALQ | 0.000 | 0.051 | 0.256 | 0.000 | 0.254 | 0.000 | 0.440 | 0.000 | ||
| 2 spectra, AIELFIR | 0.000 | 0.000 | 0.000 | 0.000 | 0.173 | 0.000 | 0.754 | 0.073 | ||
| 1 spectrum, LQGQLQGGSR | 0.000 | 0.025 | 0.000 | 0.000 | 0.391 | 0.000 | 0.584 | 0.000 | ||
| 2 spectra, RPDYDPEK | 0.000 | 0.000 | 0.000 | 0.000 | 0.250 | 0.000 | 0.713 | 0.037 | ||
| 1 spectrum, LHQSVTK | 0.000 | 0.000 | 0.000 | 0.000 | 0.134 | 0.000 | 0.771 | 0.095 | ||
| 1 spectrum, EFAPVYPILVQLLQK | 0.000 | 0.000 | 0.000 | 0.000 | 0.166 | 0.000 | 0.821 | 0.013 | ||
| 2 spectra, NPPSSDELDGIIK | 0.000 | 0.000 | 0.000 | 0.000 | 0.215 | 0.000 | 0.755 | 0.030 | ||
| 2 spectra, LYNDLWK | 0.000 | 0.000 | 0.000 | 0.000 | 0.366 | 0.028 | 0.606 | 0.000 | ||
| 2 spectra, AEWSHAR | 0.017 | 0.000 | 0.127 | 0.105 | 0.128 | 0.115 | 0.508 | 0.000 | ||
| 1 spectrum, LQQYSQNSQGAFGTR | 0.102 | 0.000 | 0.185 | 0.000 | 0.272 | 0.000 | 0.440 | 0.000 | ||
| 1 spectrum, DSLQPYEAAYLSK | 0.000 | 0.000 | 0.000 | 0.000 | 0.205 | 0.000 | 0.776 | 0.019 | ||
| 4 spectra, VLTQPSQSAAR | 0.000 | 0.000 | 0.000 | 0.000 | 0.165 | 0.000 | 0.731 | 0.104 |
| Plot | Mito | Lyso or Perox | ER | Golgi | PM | Cytosol | Nucleus | ||||||
| Expt B |
4 peptides |
6 spectra |
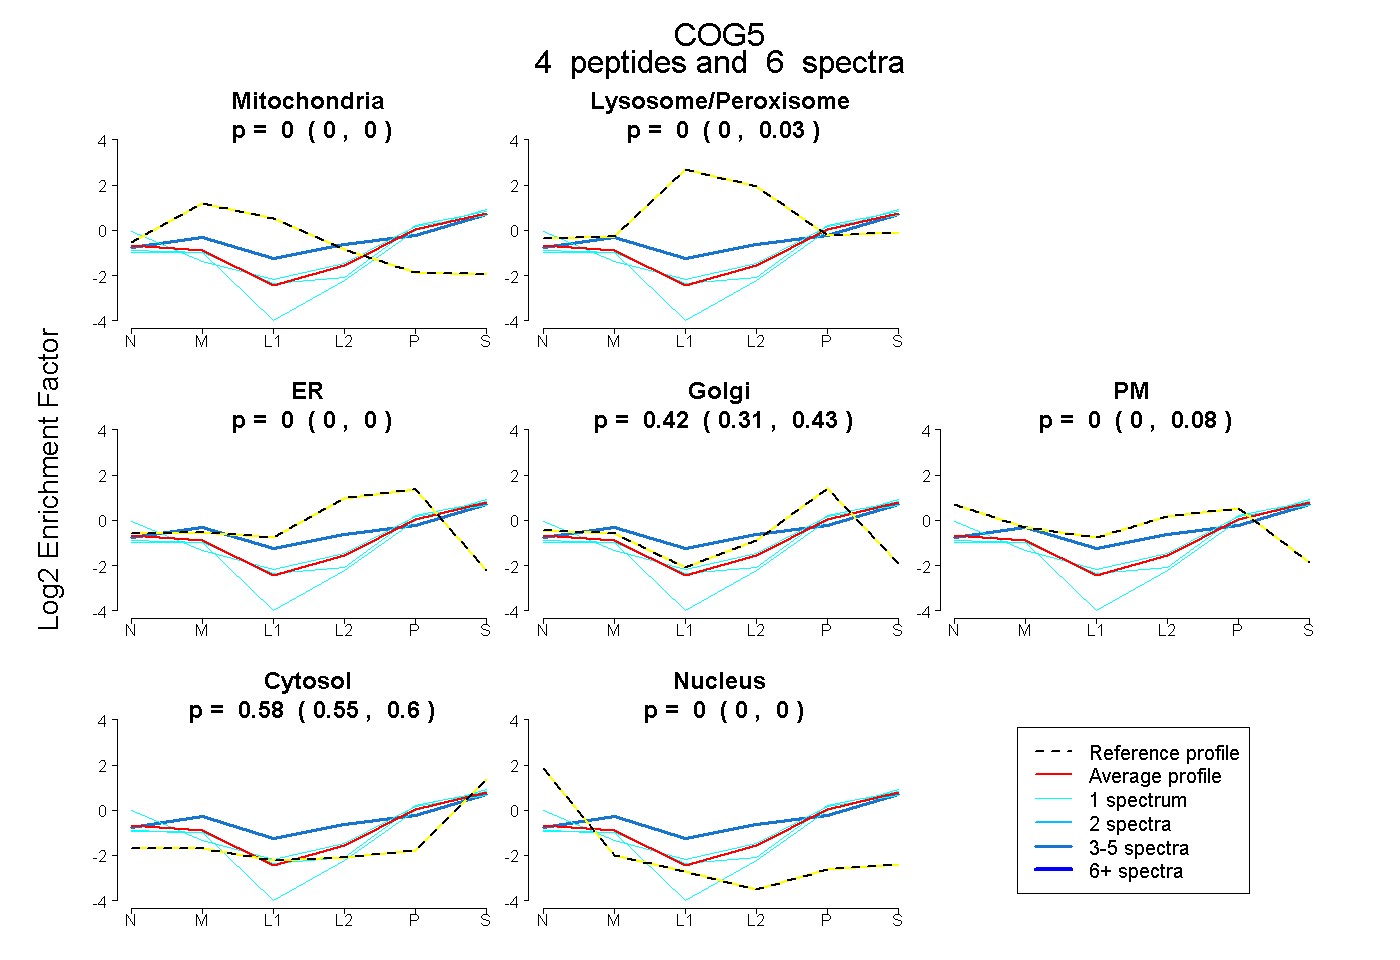 |
0.000 0.000 | 0.000 |
0.000 0.000 | 0.034 |
0.000 0.000 | 0.000 |
0.418 0.315 | 0.429 |
0.000 0.000 | 0.084 |
0.582 0.553 | 0.600 |
0.000 0.000 | 0.000 |
|||
| Plot | Lyso | Other | |||||||||||
| Expt C |
3 peptides |
5 spectra |
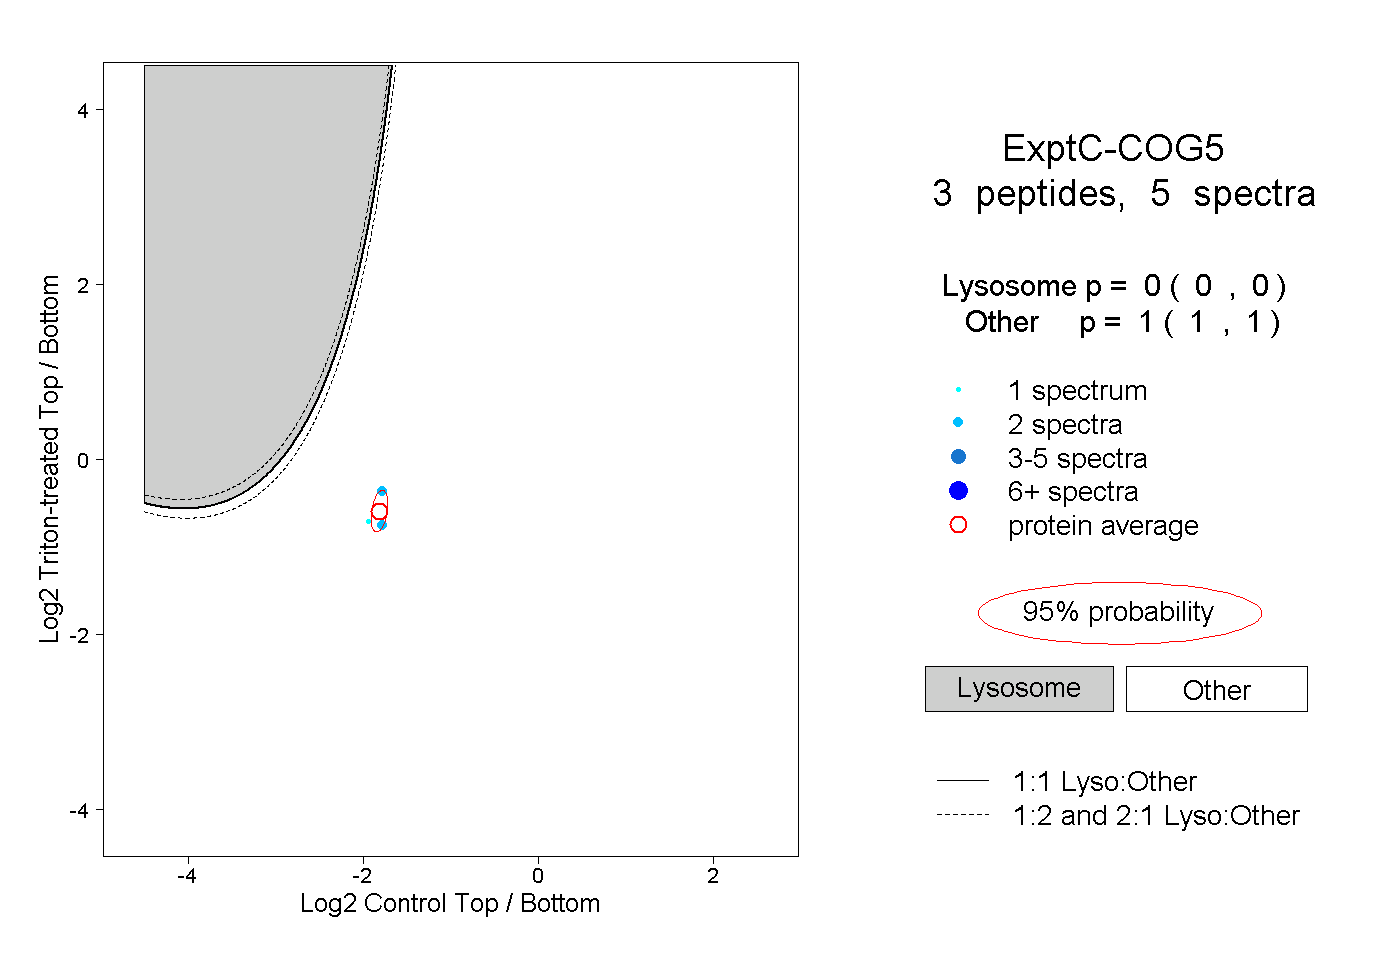 |
0.000 0.000 | 0.000 |
1.000 1.000 | 1.000 |
||||||||
| Plot | Lyso | Other | |||||||||||
| Expt D |
1 peptide |
1 spectrum |
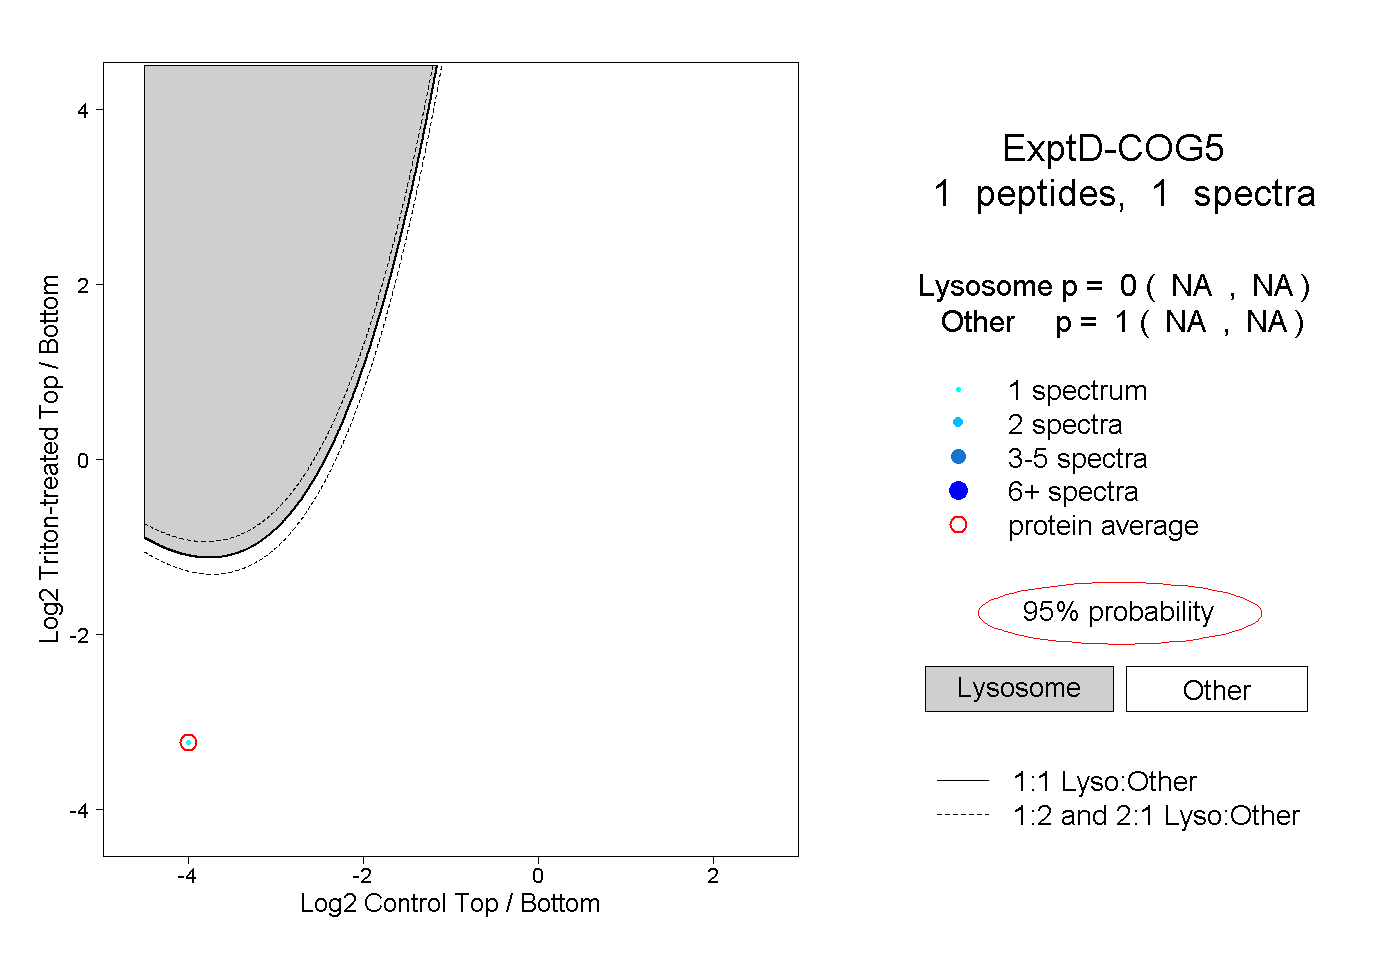 |
0.000 NA | NA |
1.000 NA | NA |