 5
5peptides
spectra
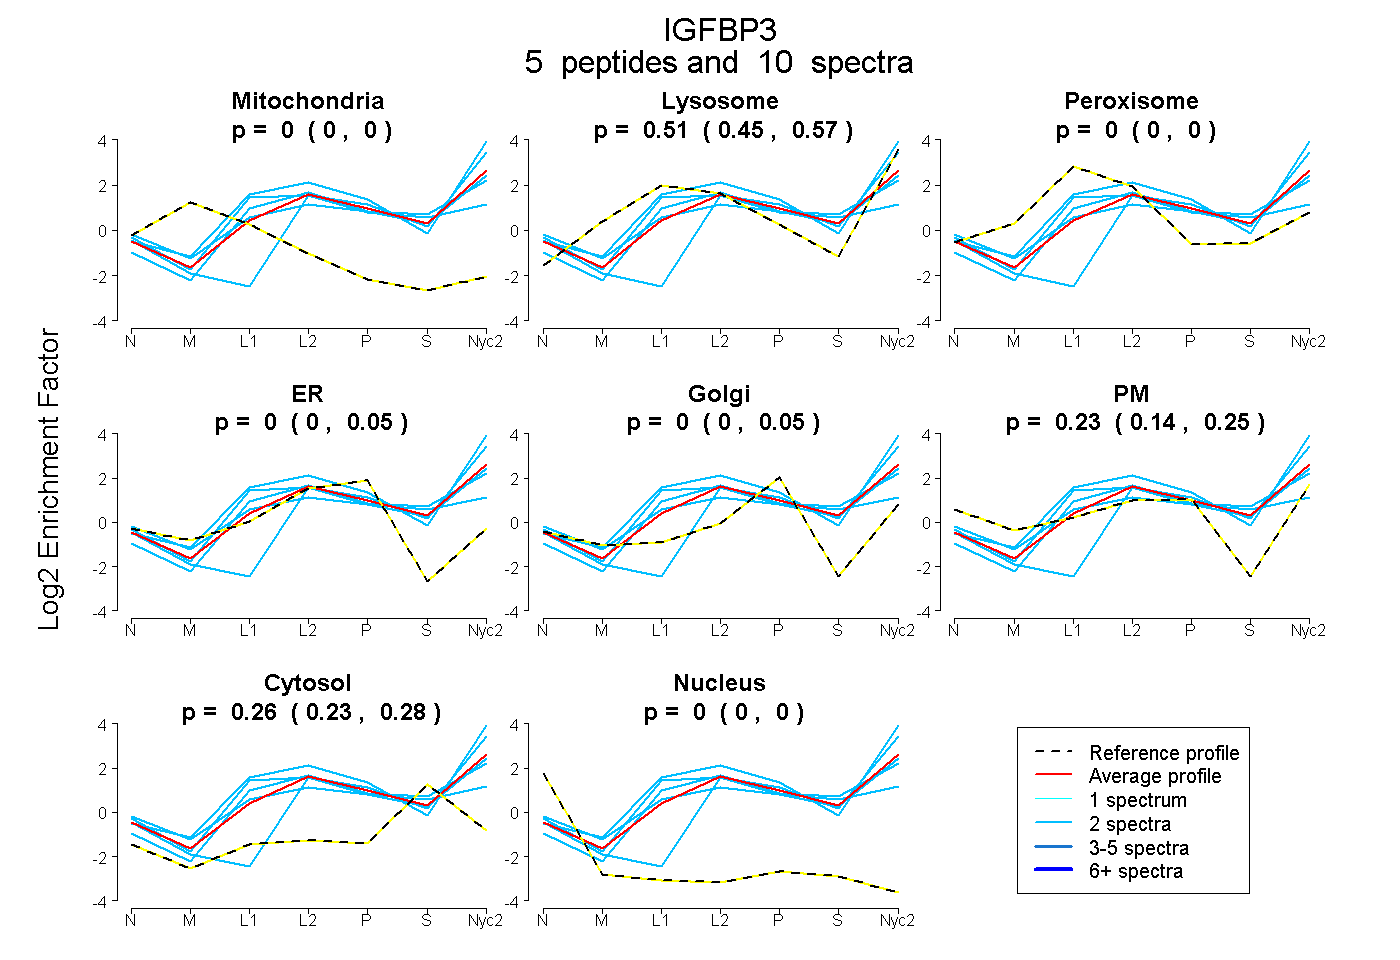
0.000 | 0.000
0.453 | 0.573
0.000 | 0.000
0.000 | 0.050
0.000 | 0.051
0.142 | 0.249
0.231 | 0.280
0.000 | 0.000
5peptides
spectra
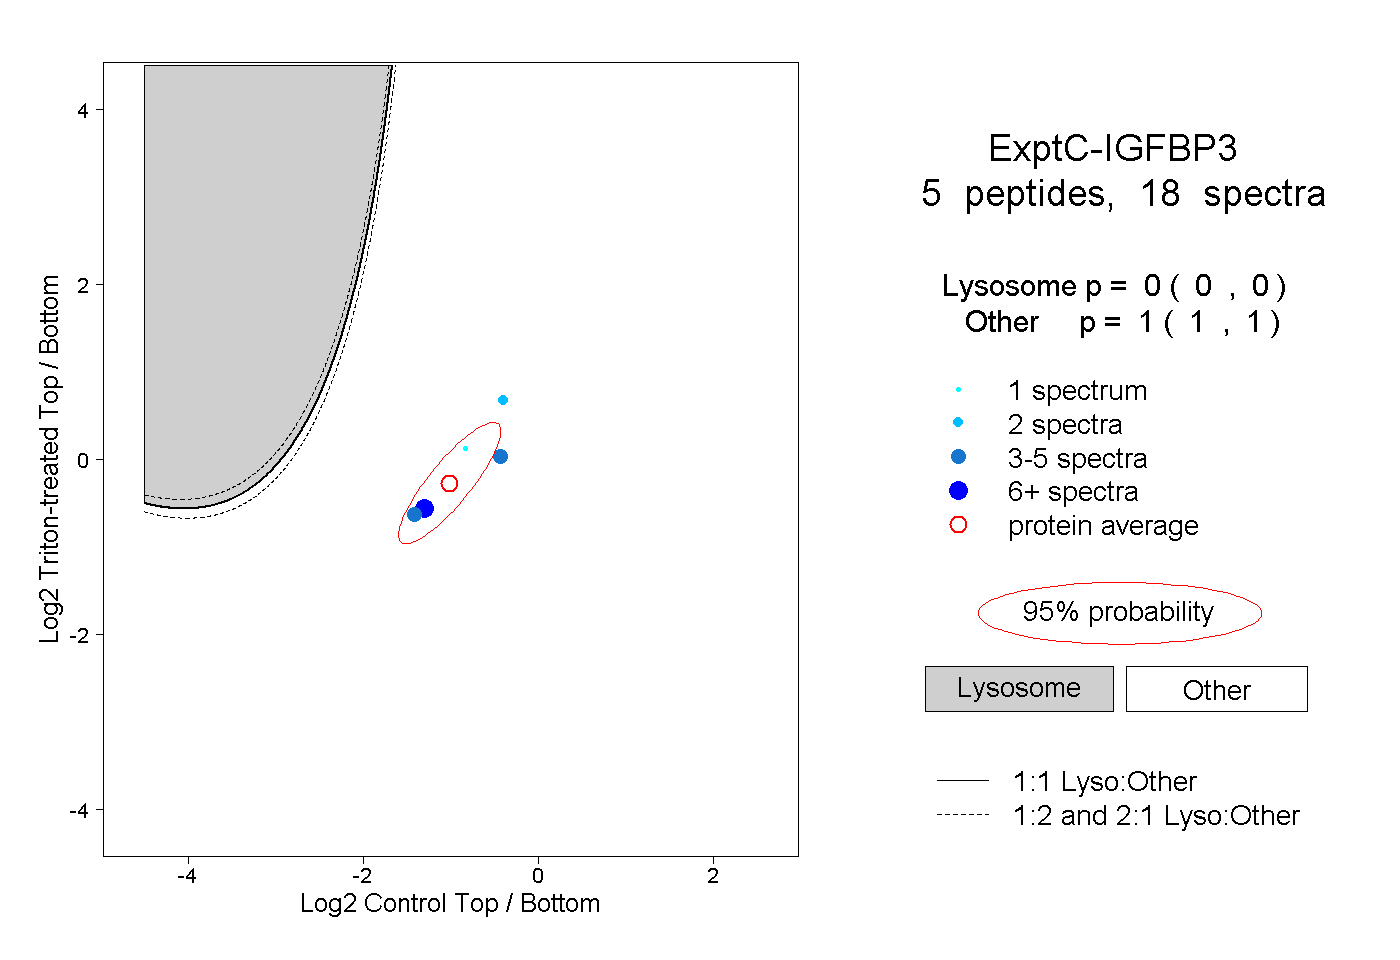
0.000 | 0.000
1.000 | 1.000
2peptides
spectra
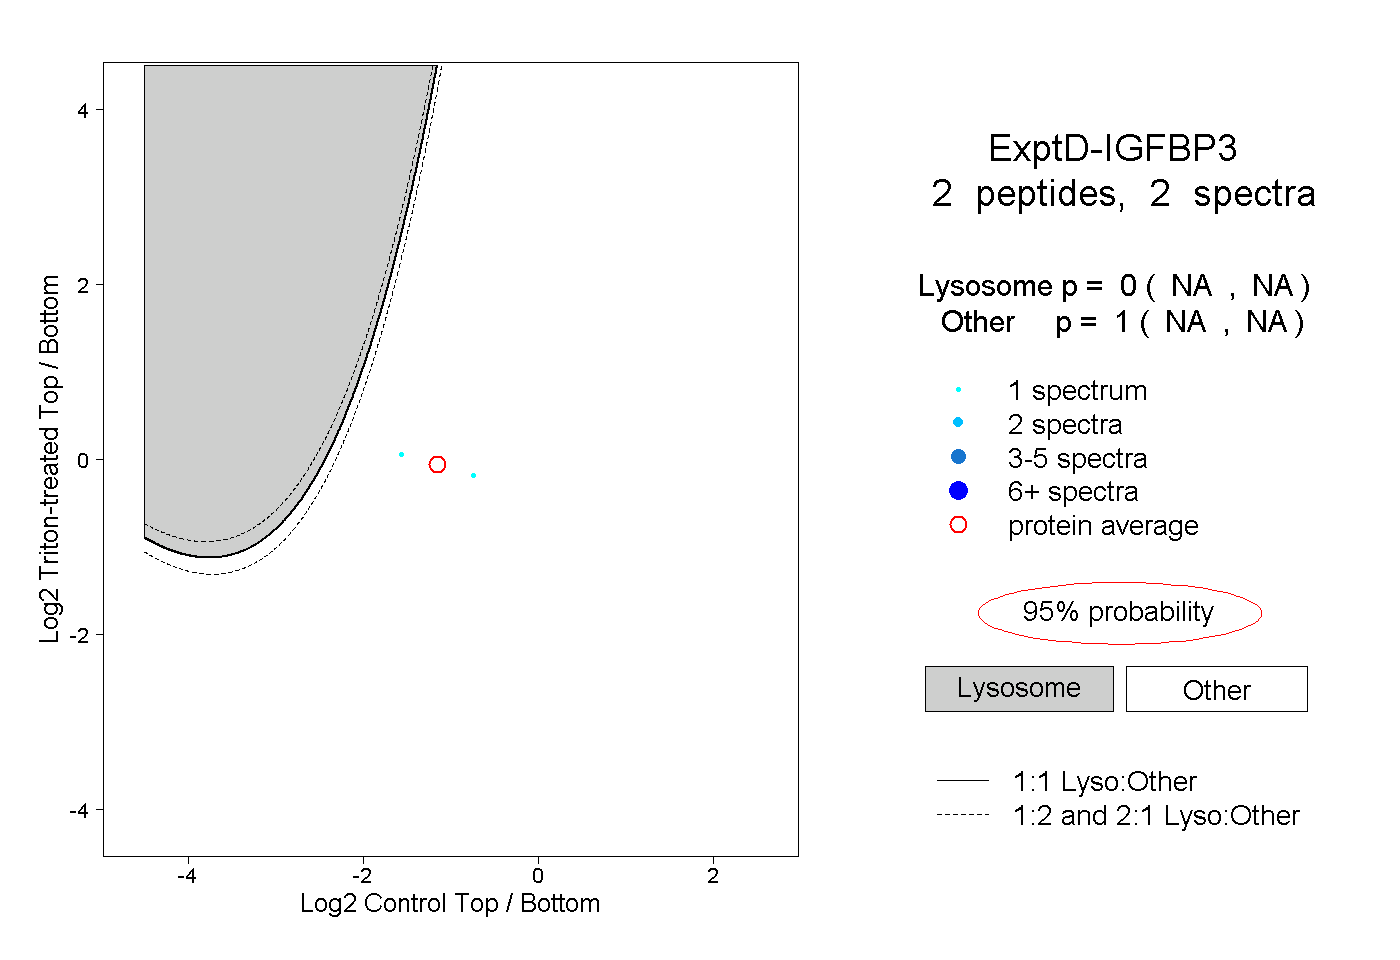
NA | NA
NA | NA