 5
5peptides
spectra
0.000 | 0.000
0.453 | 0.573
0.000 | 0.000
0.000 | 0.050
0.000 | 0.051
0.142 | 0.249
0.231 | 0.280
0.000 | 0.000
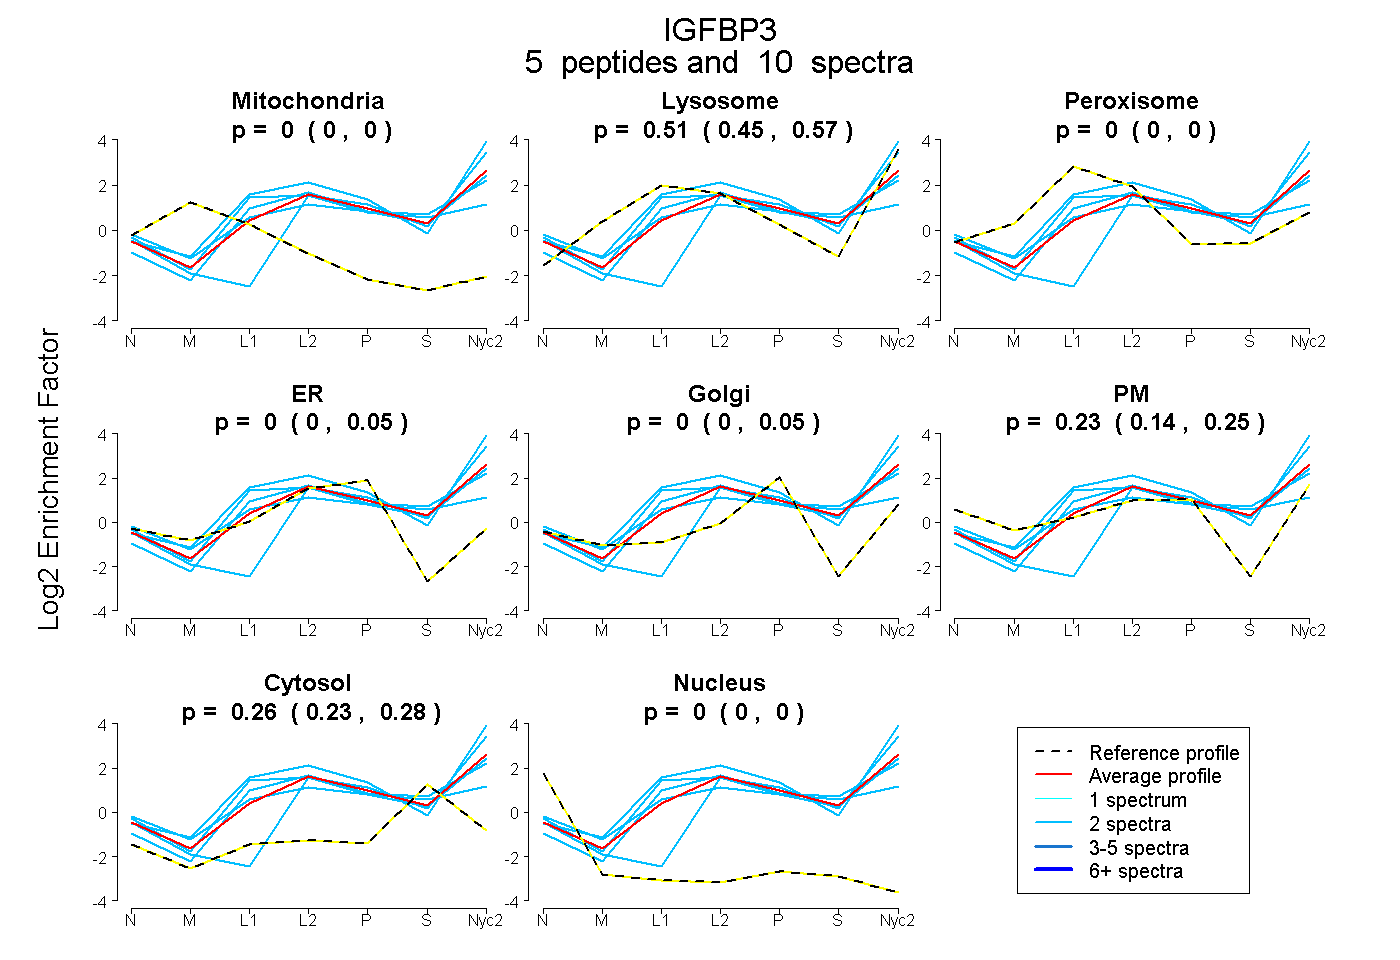
| Plot | Mito | Lyso | Perox | ER | Golgi | PM | Cytosol | Nucleus | |||||
| Expt A |
5 peptides |
10 spectra |
|
0.000 0.000 | 0.000 |
0.512 0.453 | 0.573 |
0.000 0.000 | 0.000 |
0.000 0.000 | 0.050 |
0.000 0.000 | 0.051 |
0.228 0.142 | 0.249 |
0.261 0.231 | 0.280 |
0.000 0.000 | 0.000 |
| 2 spectra, ETEYGPCR | 0.000 | 0.468 | 0.000 | 0.000 | 0.000 | 0.267 | 0.265 | 0.000 | ||
| 2 spectra, EGDACGVYTER | 0.000 | 0.586 | 0.000 | 0.078 | 0.000 | 0.000 | 0.336 | 0.000 | ||
| 2 spectra, EMEDTLNHLK | 0.000 | 0.691 | 0.000 | 0.000 | 0.000 | 0.158 | 0.151 | 0.000 | ||
| 2 spectra, FLNVLSPR | 0.000 | 0.815 | 0.000 | 0.000 | 0.000 | 0.163 | 0.021 | 0.000 | ||
| 2 spectra, EPGCGCCLTCALR | 0.000 | 0.032 | 0.000 | 0.026 | 0.216 | 0.258 | 0.469 | 0.000 |
| Plot | Lyso | Other | |||||||||||
| Expt C |
5 peptides |
18 spectra |
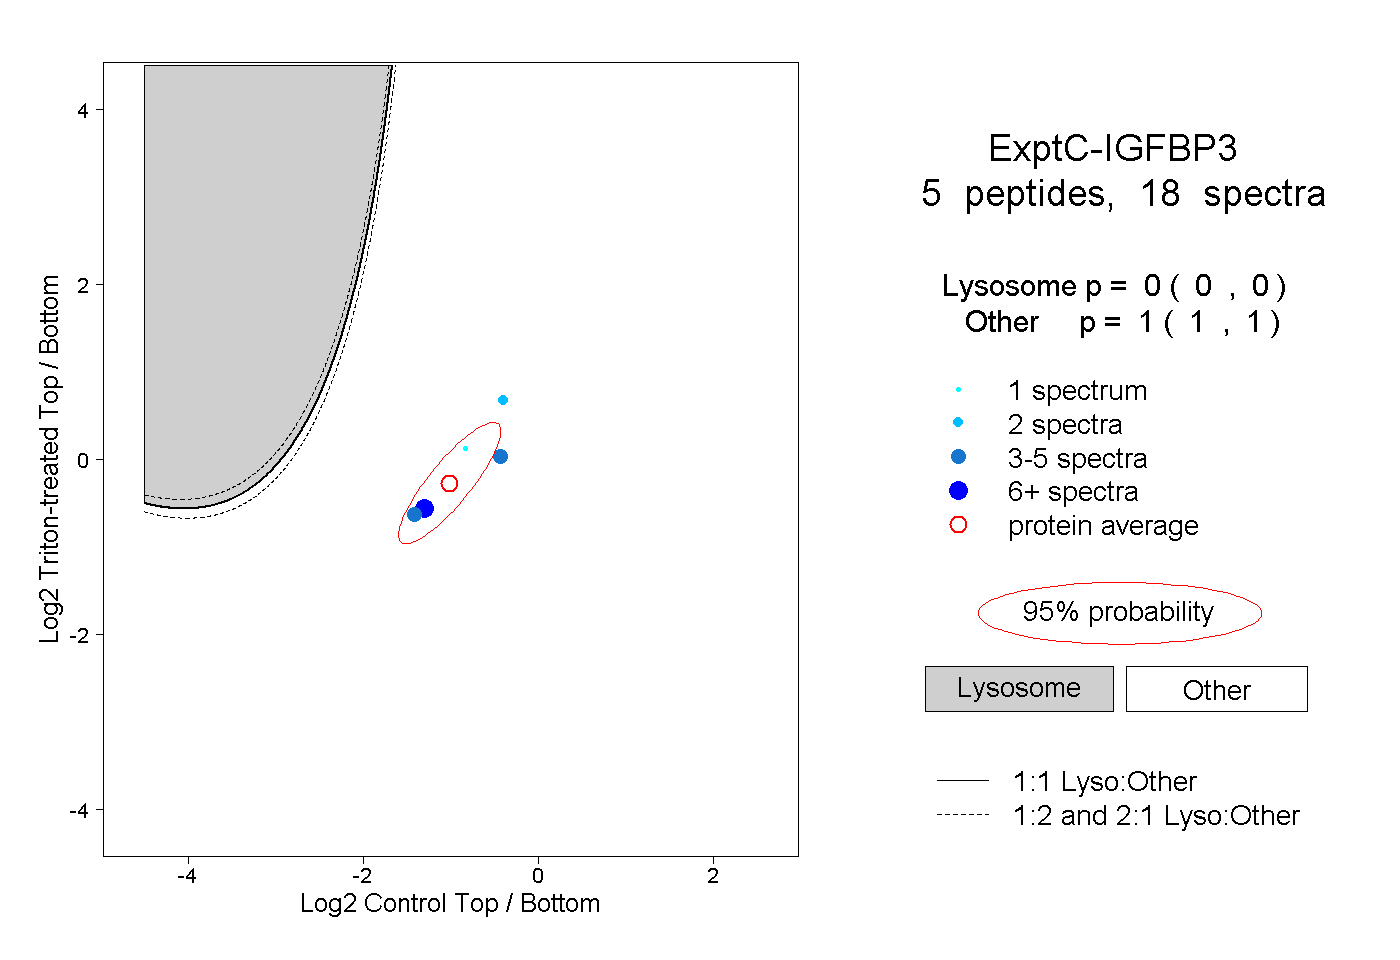 |
0.000 0.000 | 0.000 |
1.000 1.000 | 1.000 |
||||||||
| Plot | Lyso | Other | |||||||||||
| Expt D |
2 peptides |
2 spectra |
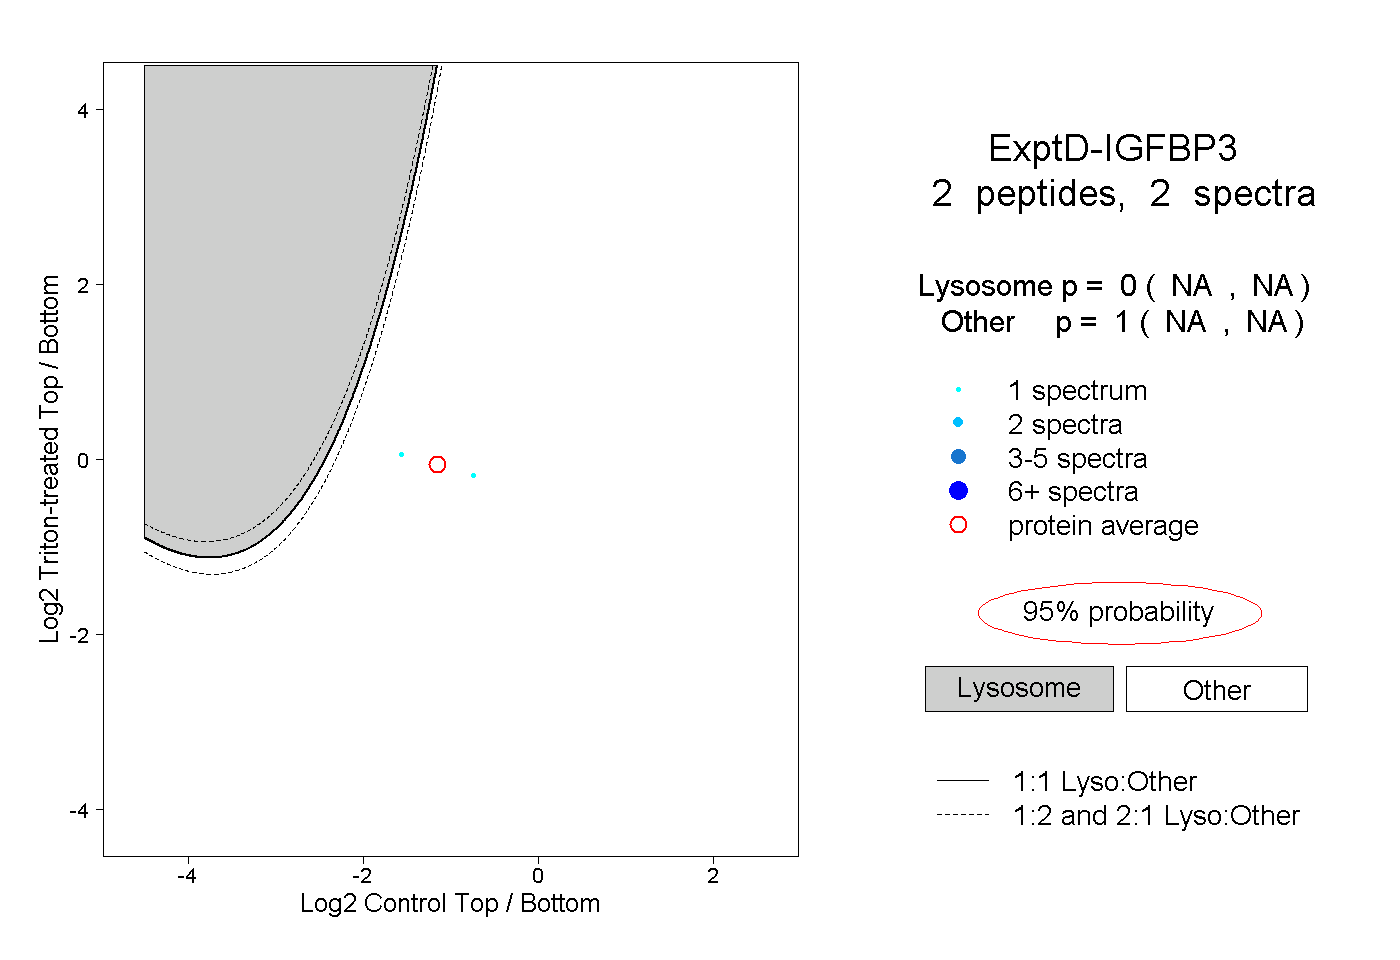 |
0.000 NA | NA |
1.000 NA | NA |