 8
8peptides
spectra
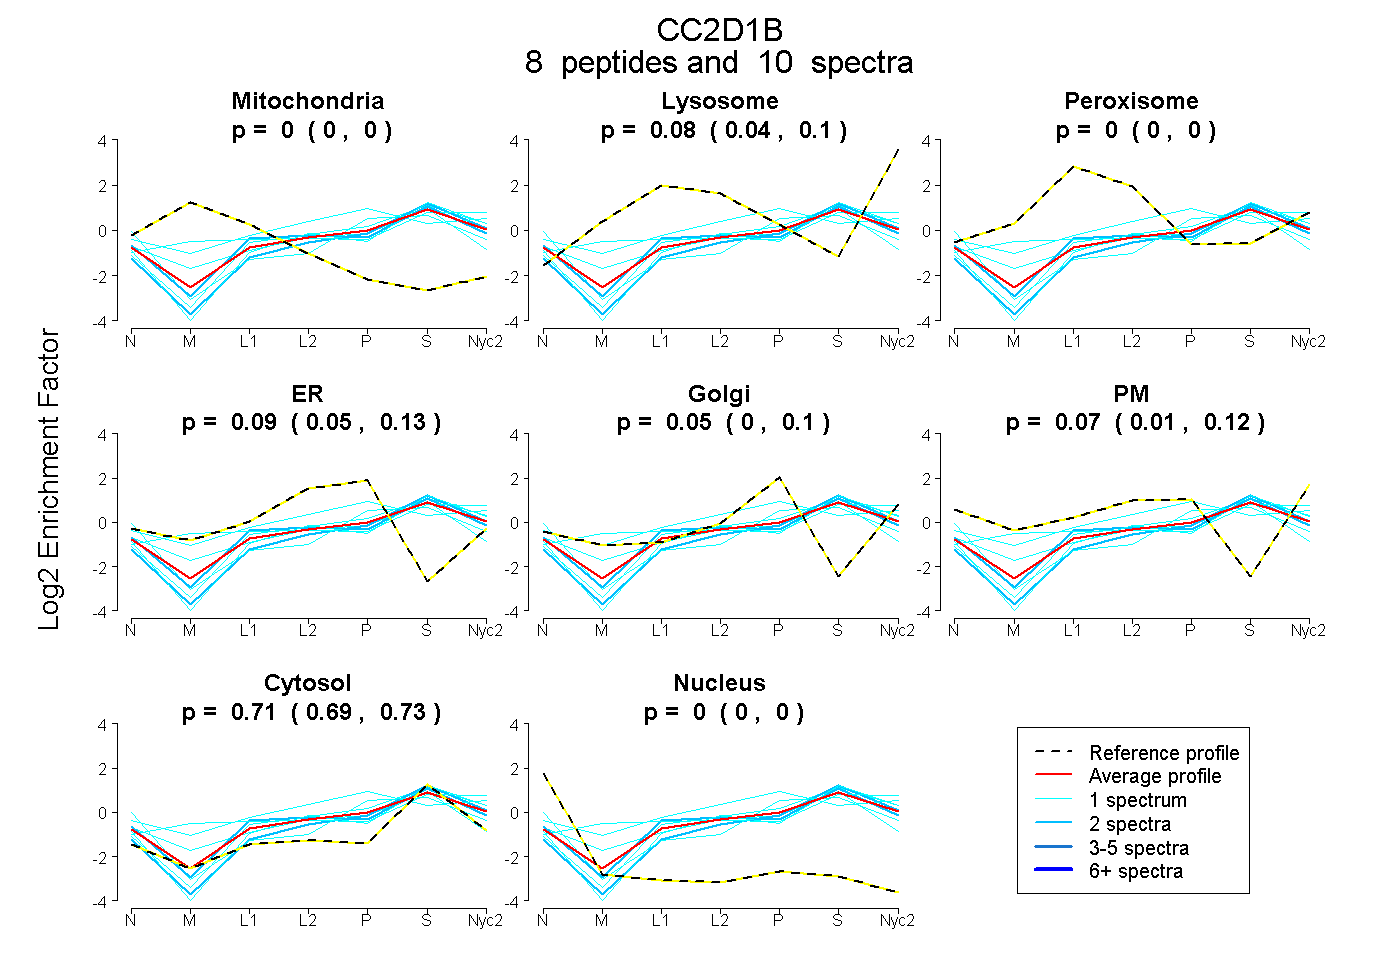
0.000 | 0.000
0.044 | 0.098
0.000 | 0.000
0.049 | 0.134
0.000 | 0.097
0.012 | 0.123
0.690 | 0.729
0.000 | 0.000
3peptides
spectra
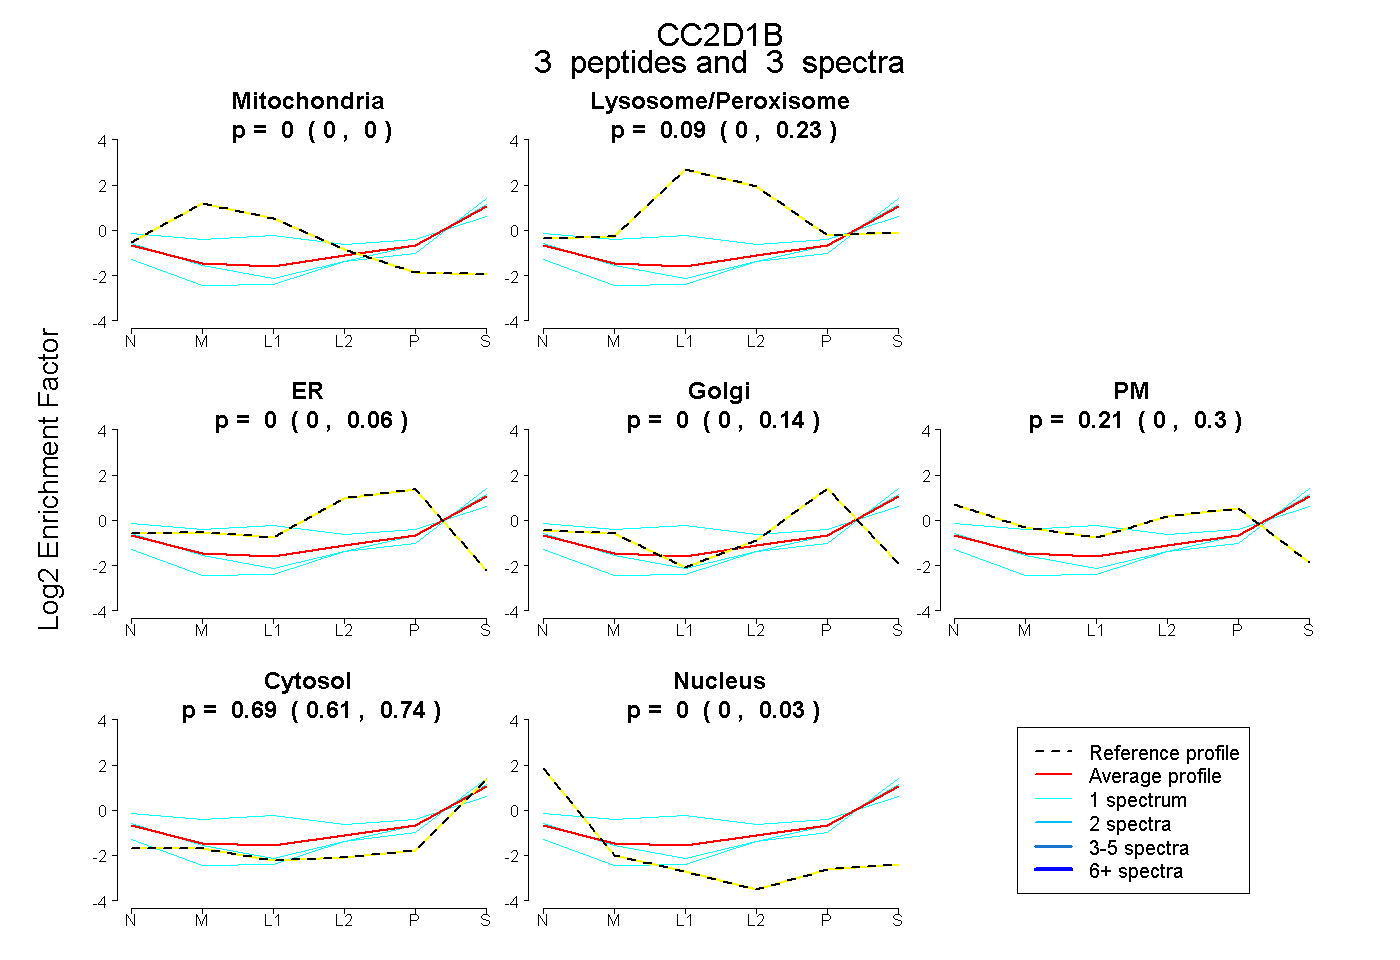
0.000 | 0.000
0.000 | 0.233
0.000 | 0.055
0.000 | 0.144
0.000 | 0.302
0.606 | 0.743
0.000 | 0.026
5peptides
spectra
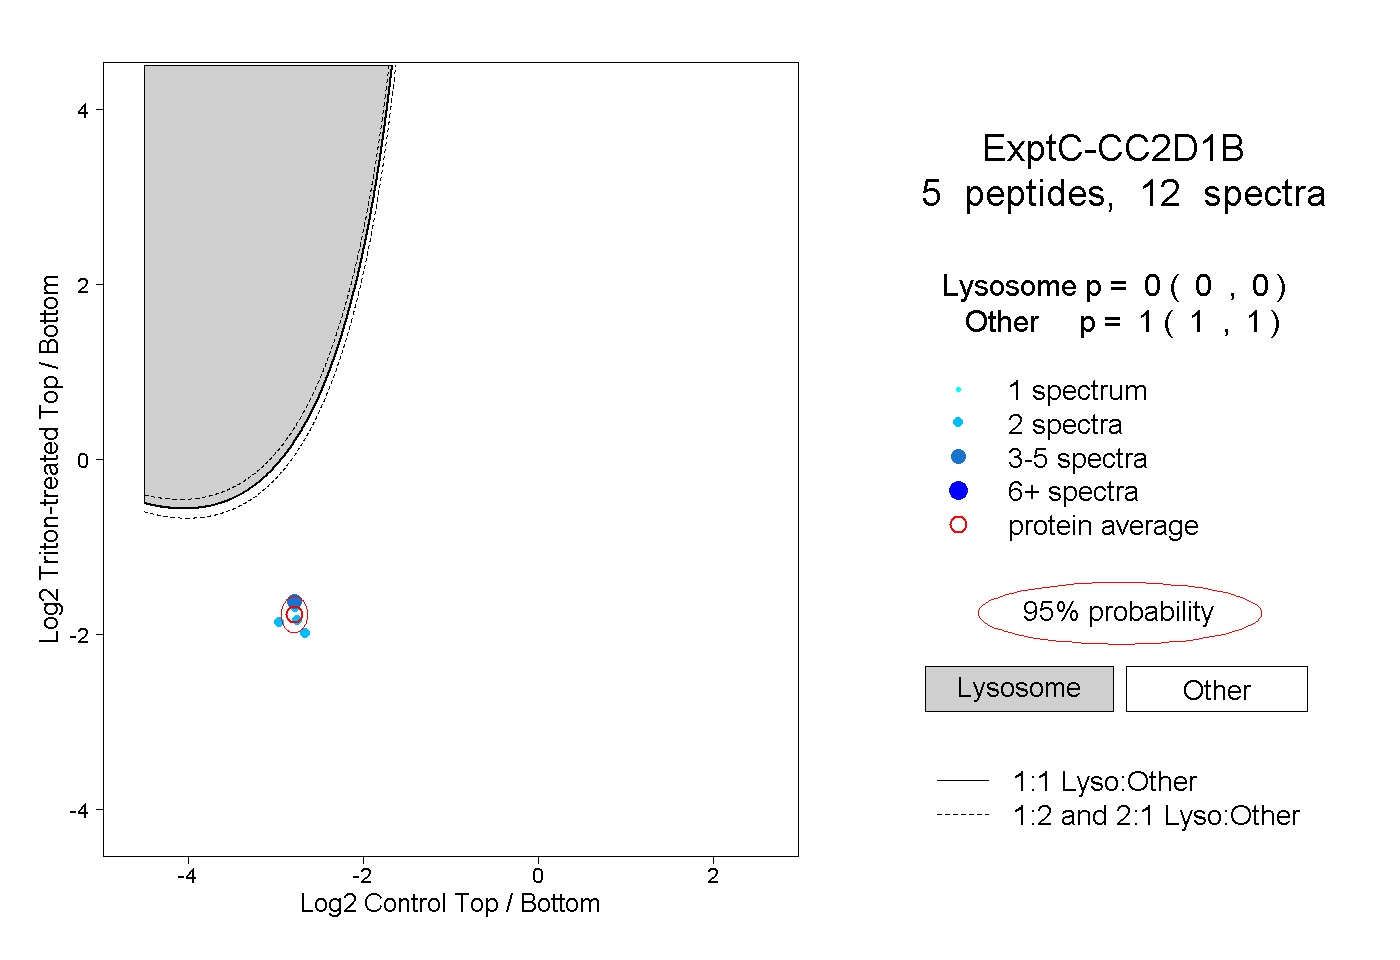
0.000 | 0.000
1.000 | 1.000