 8
8peptides
spectra
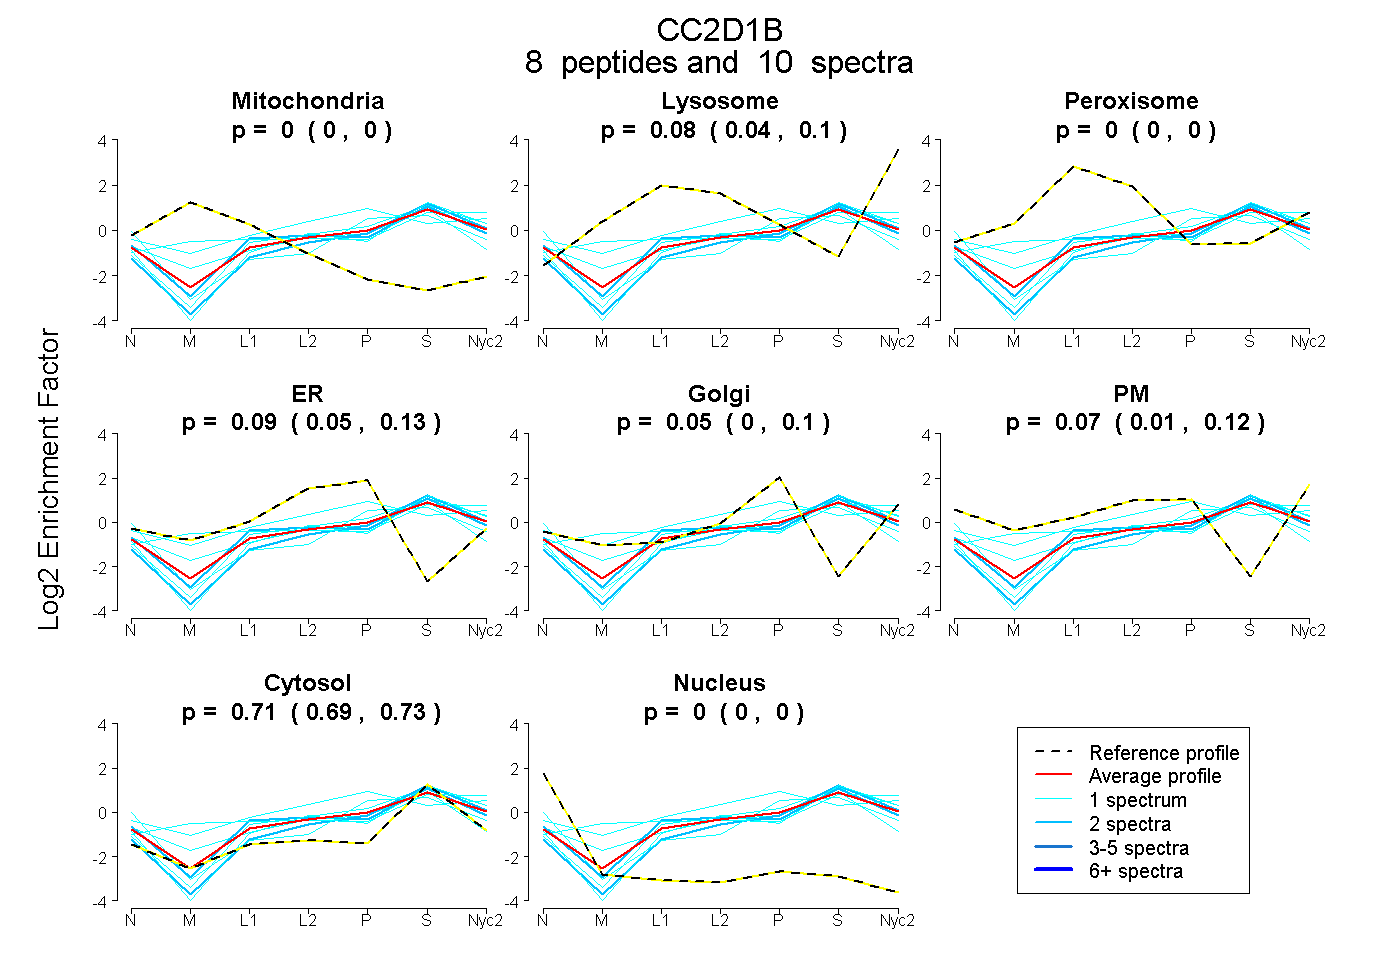
0.000 | 0.000
0.044 | 0.098
0.000 | 0.000
0.049 | 0.134
0.000 | 0.097
0.012 | 0.123
0.690 | 0.729
0.000 | 0.000
| Plot | Mito | Lyso | Perox | ER | Golgi | PM | Cytosol | Nucleus | |||||
| Expt A |
8 peptides |
10 spectra |
|
0.000 0.000 | 0.000 |
0.075 0.044 | 0.098 |
0.000 0.000 | 0.000 |
0.094 0.049 | 0.134 |
0.048 0.000 | 0.097 |
0.071 0.012 | 0.123 |
0.711 0.690 | 0.729 |
0.000 0.000 | 0.000 |
| 1 spectrum, QFMHQGNVAETTR | 0.000 | 0.058 | 0.219 | 0.000 | 0.378 | 0.009 | 0.337 | 0.000 | ||
| 1 spectrum, APLPMAHIEK | 0.000 | 0.124 | 0.000 | 0.061 | 0.078 | 0.000 | 0.737 | 0.000 | ||
| 1 spectrum, CLLFSK | 0.000 | 0.000 | 0.065 | 0.217 | 0.000 | 0.000 | 0.718 | 0.000 | ||
| 2 spectra, EIMEVLDGR | 0.000 | 0.015 | 0.000 | 0.000 | 0.147 | 0.000 | 0.837 | 0.000 | ||
| 1 spectrum, TVLDALQQR | 0.038 | 0.346 | 0.000 | 0.000 | 0.000 | 0.038 | 0.578 | 0.000 | ||
| 1 spectrum, VPSPLTDEEGDFILIHHEDLR | 0.000 | 0.047 | 0.000 | 0.005 | 0.000 | 0.100 | 0.848 | 0.000 | ||
| 2 spectra, RPPAHQERPSK | 0.000 | 0.000 | 0.115 | 0.073 | 0.000 | 0.071 | 0.742 | 0.000 | ||
| 1 spectrum, ESLSPSVR | 0.000 | 0.000 | 0.000 | 0.000 | 0.316 | 0.000 | 0.670 | 0.015 |
| Plot | Mito | Lyso or Perox | ER | Golgi | PM | Cytosol | Nucleus | ||||||
| Expt B |
3 peptides |
3 spectra |
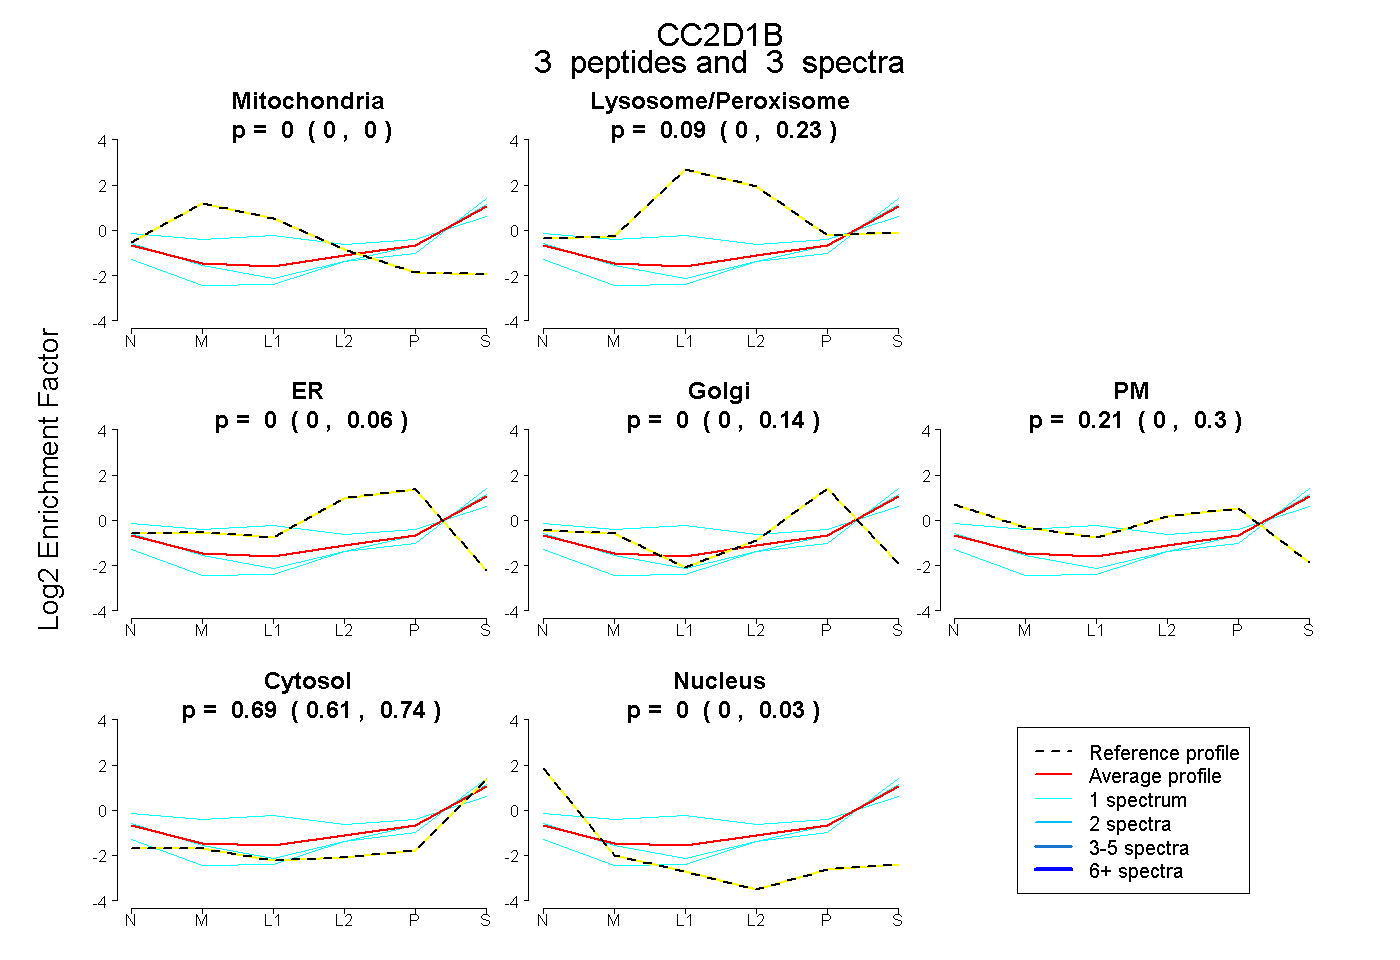 |
0.000 0.000 | 0.000 |
0.091 0.000 | 0.233 |
0.000 0.000 | 0.055 |
0.005 0.000 | 0.144 |
0.214 0.000 | 0.302 |
0.691 0.606 | 0.743 |
0.000 0.000 | 0.026 |
|||
| Plot | Lyso | Other | |||||||||||
| Expt C |
5 peptides |
12 spectra |
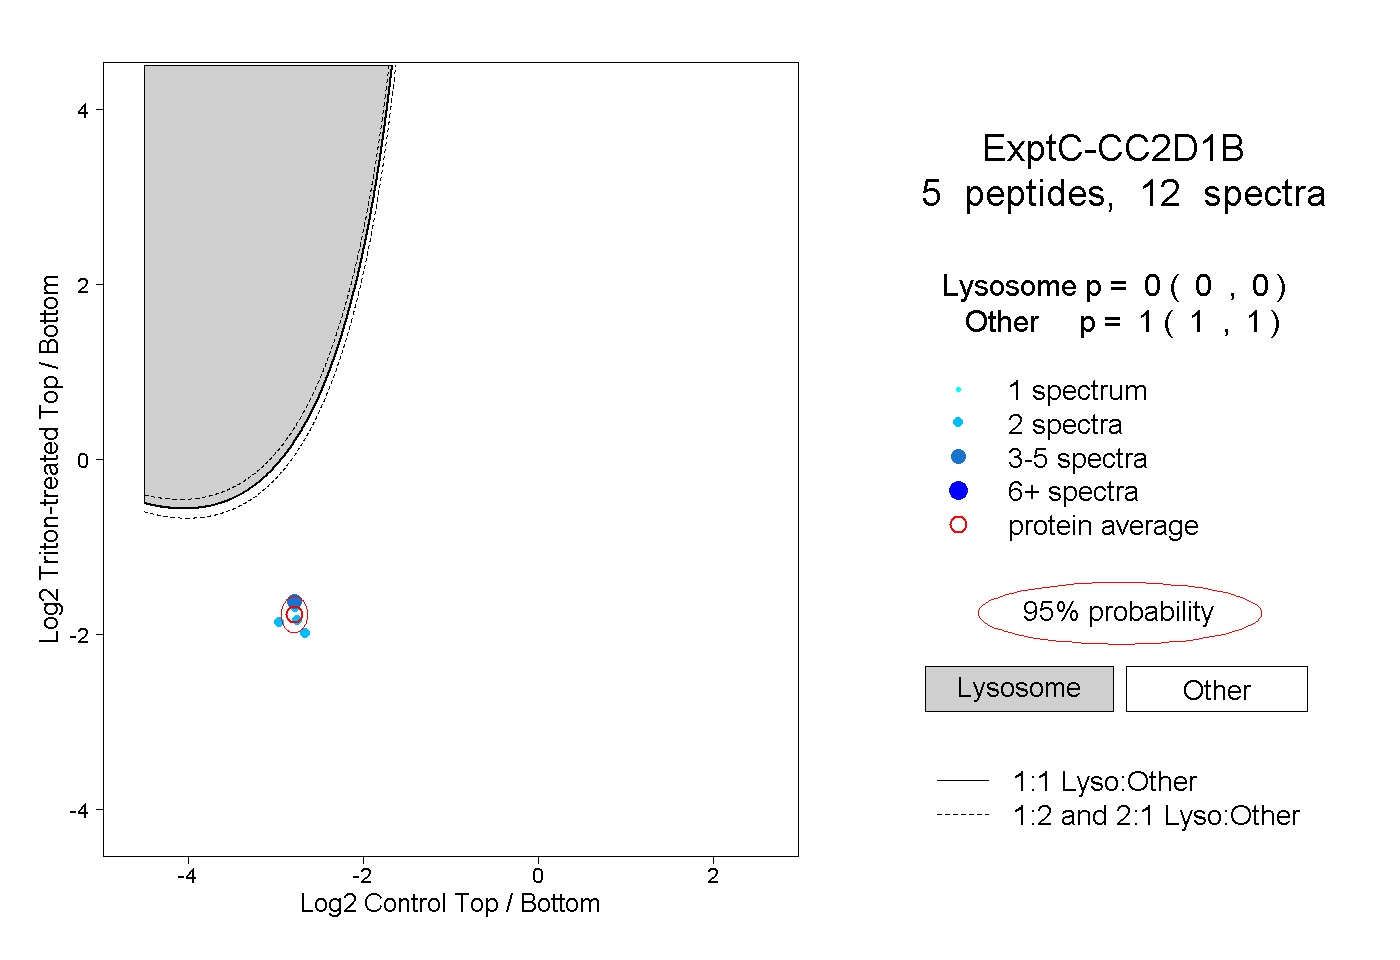 |
0.000 0.000 | 0.000 |
1.000 1.000 | 1.000 |