 4
4peptides
spectra
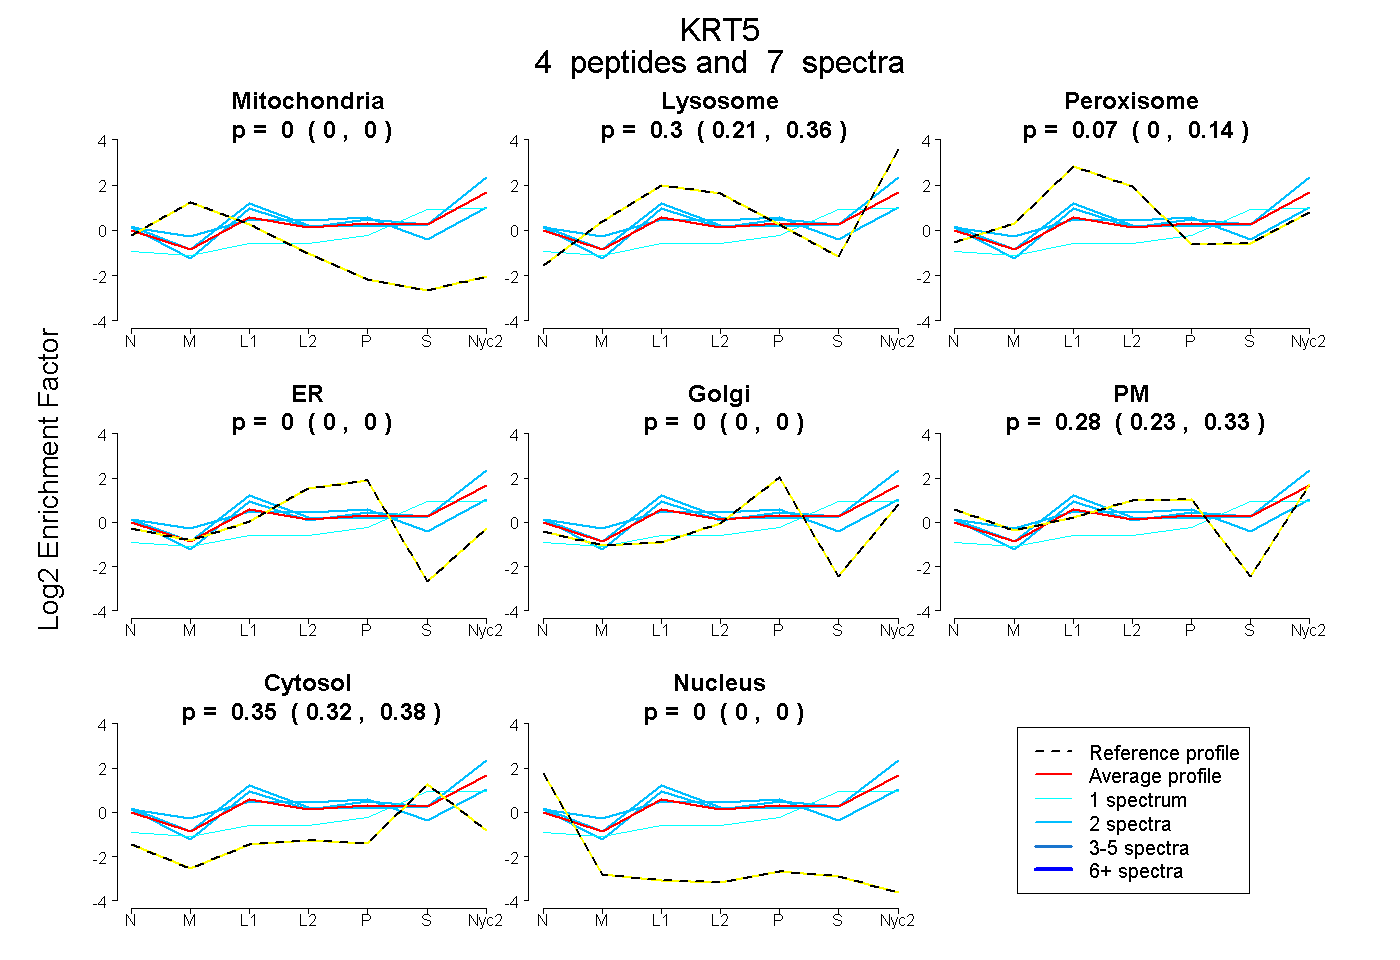
0.000 | 0.000
0.207 | 0.364
0.000 | 0.143
0.000 | 0.000
0.000 | 0.000
0.227 | 0.333
0.318 | 0.376
0.000 | 0.000
4peptides
spectra
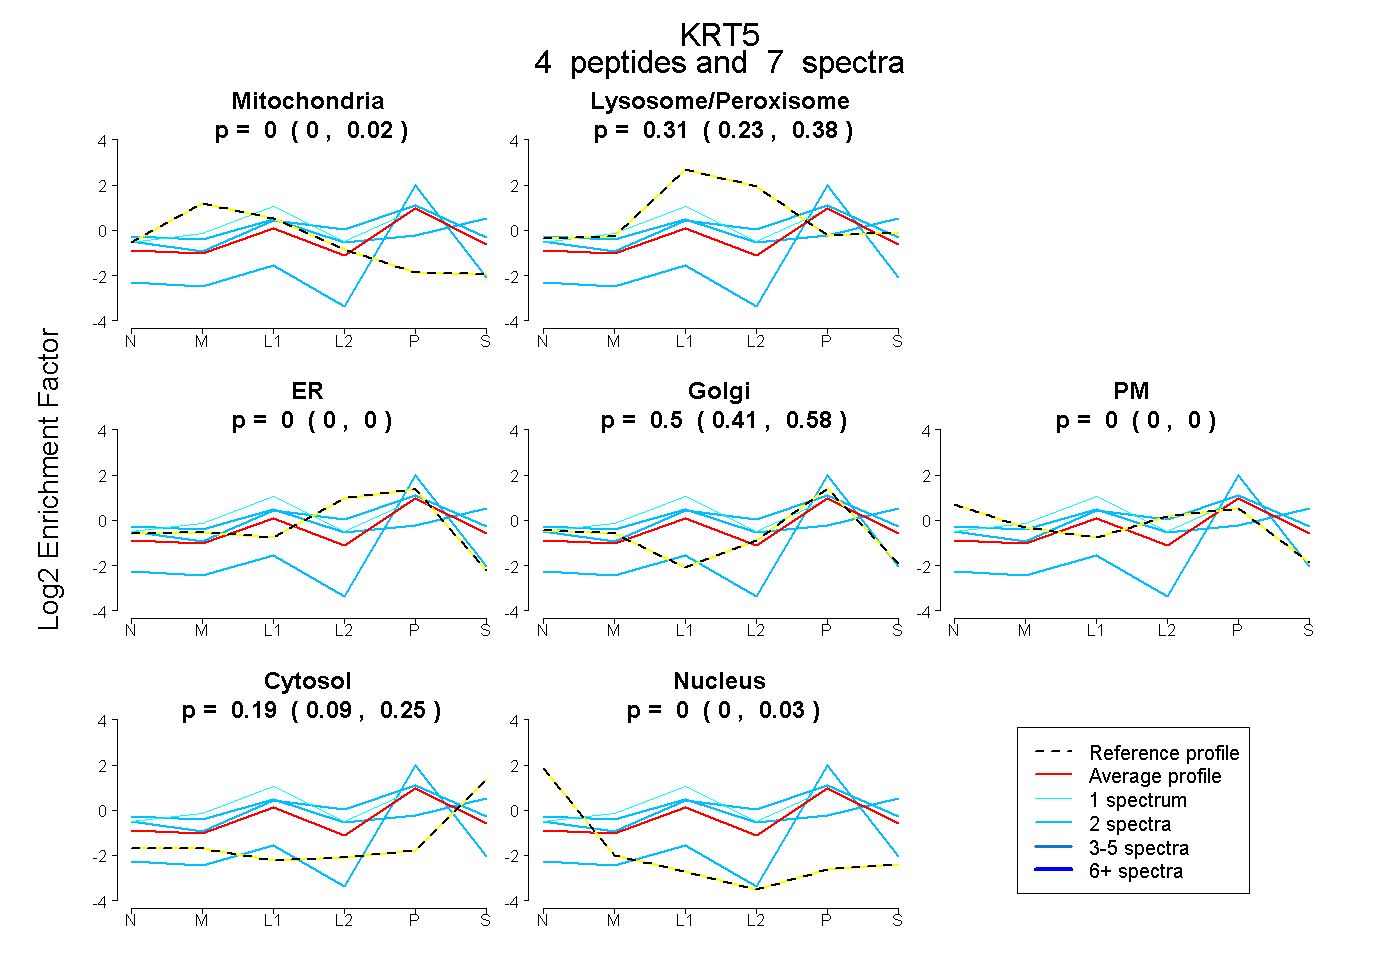
0.000 | 0.020
0.229 | 0.376
0.000 | 0.000
0.408 | 0.579
0.000 | 0.000
0.095 | 0.254
0.000 | 0.027
9peptides
spectra
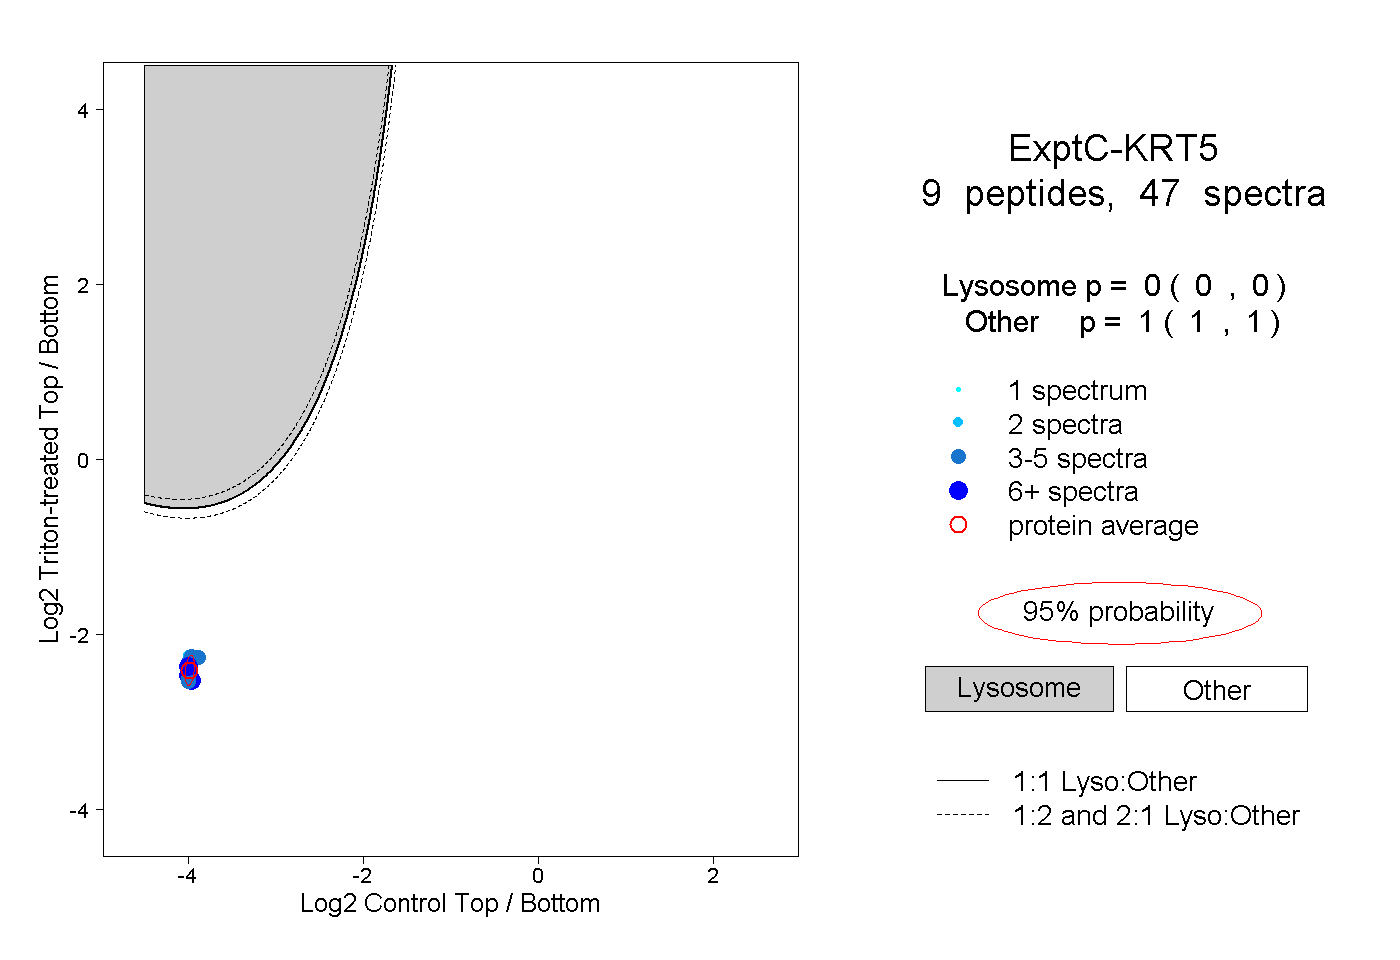
0.000 | 0.000
1.000 | 1.000
4peptides
spectra
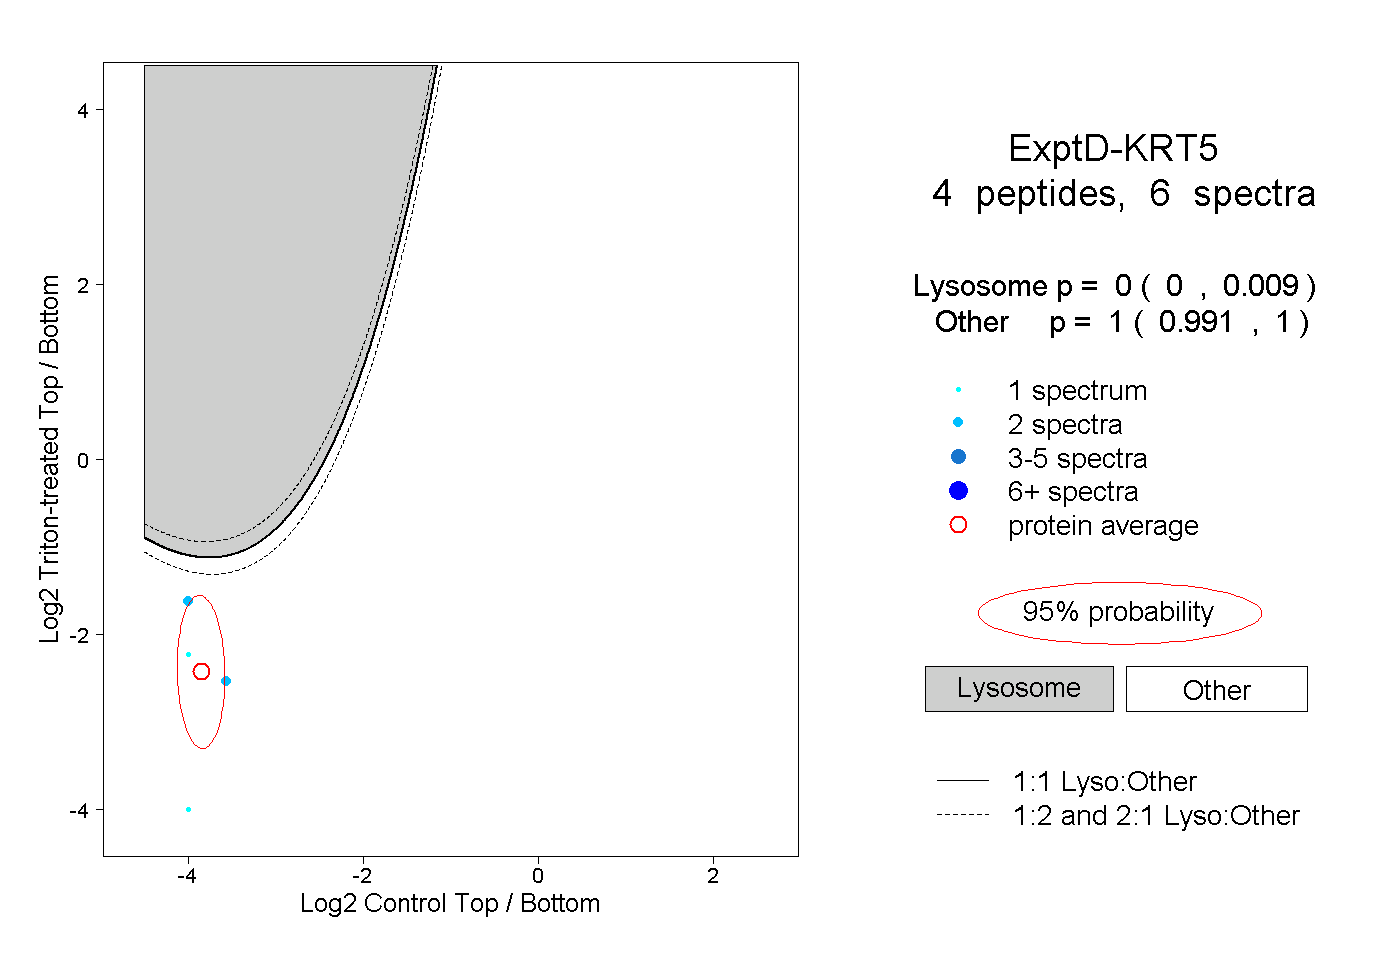
0.000 | 0.009
0.991 | 1.000