 24
24peptides
spectra
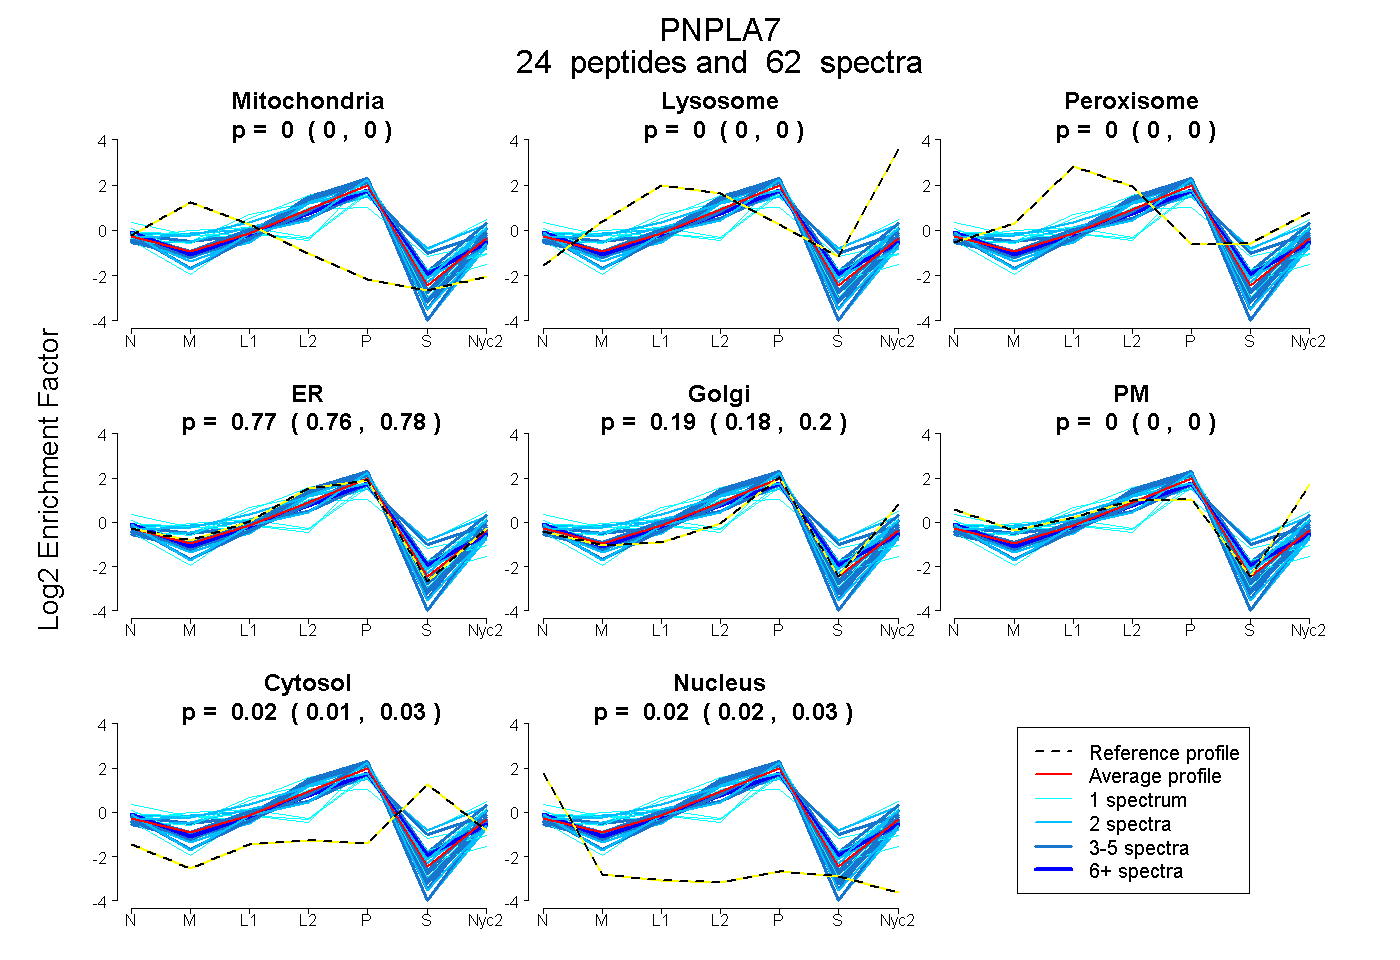
0.000 | 0.000
0.000 | 0.000
0.000 | 0.000
0.756 | 0.776
0.175 | 0.198
0.000 | 0.000
0.012 | 0.029
0.020 | 0.028
6peptides
spectra
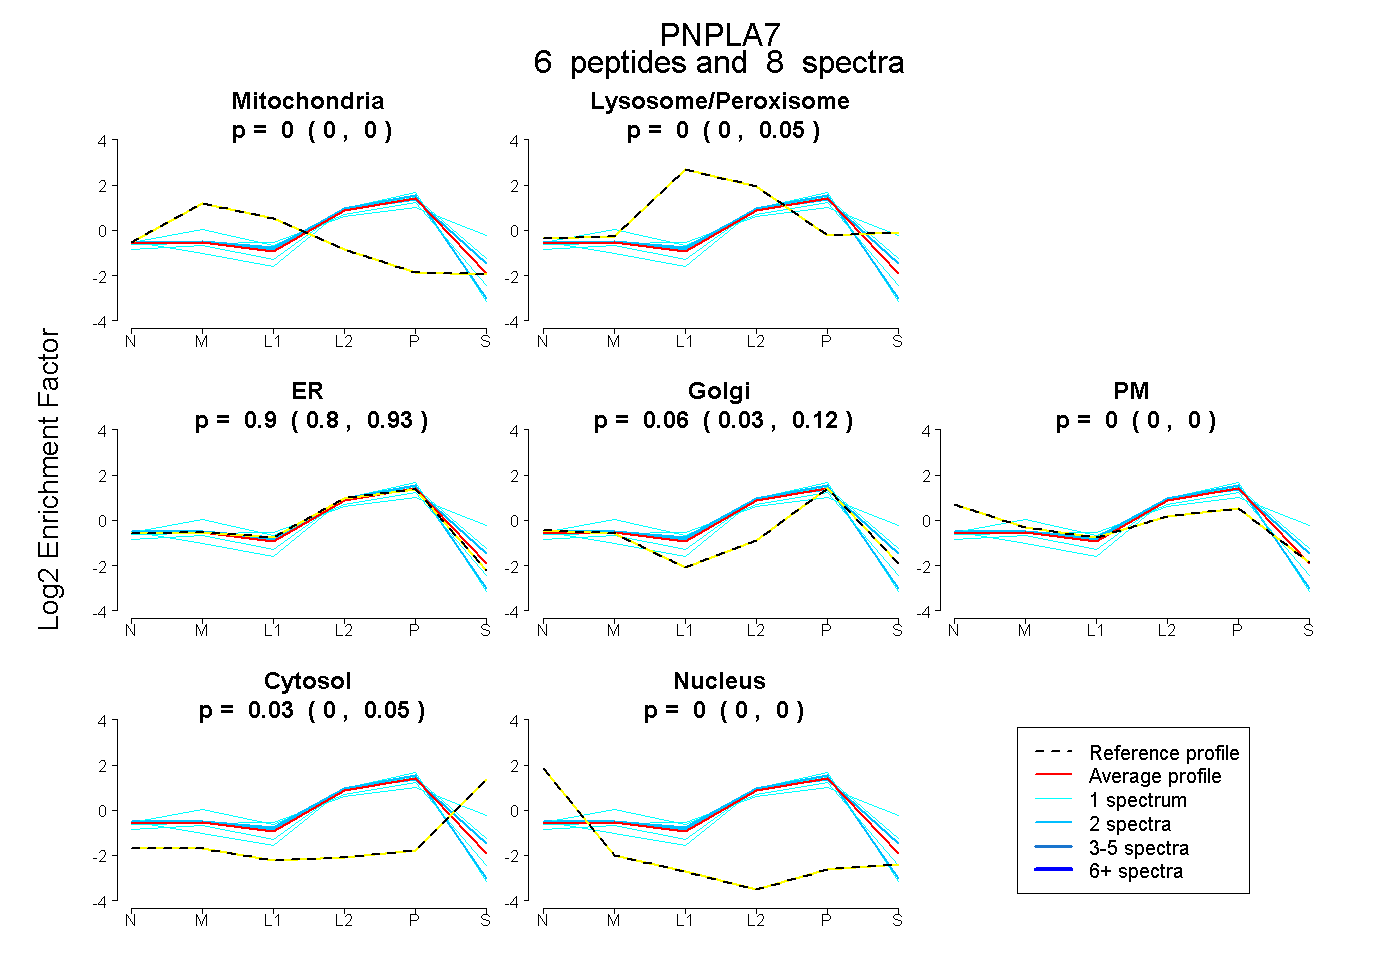
0.000 | 0.000
0.000 | 0.045
0.800 | 0.930
0.031 | 0.117
0.000 | 0.000
0.000 | 0.054
0.000 | 0.000
15peptides
spectra
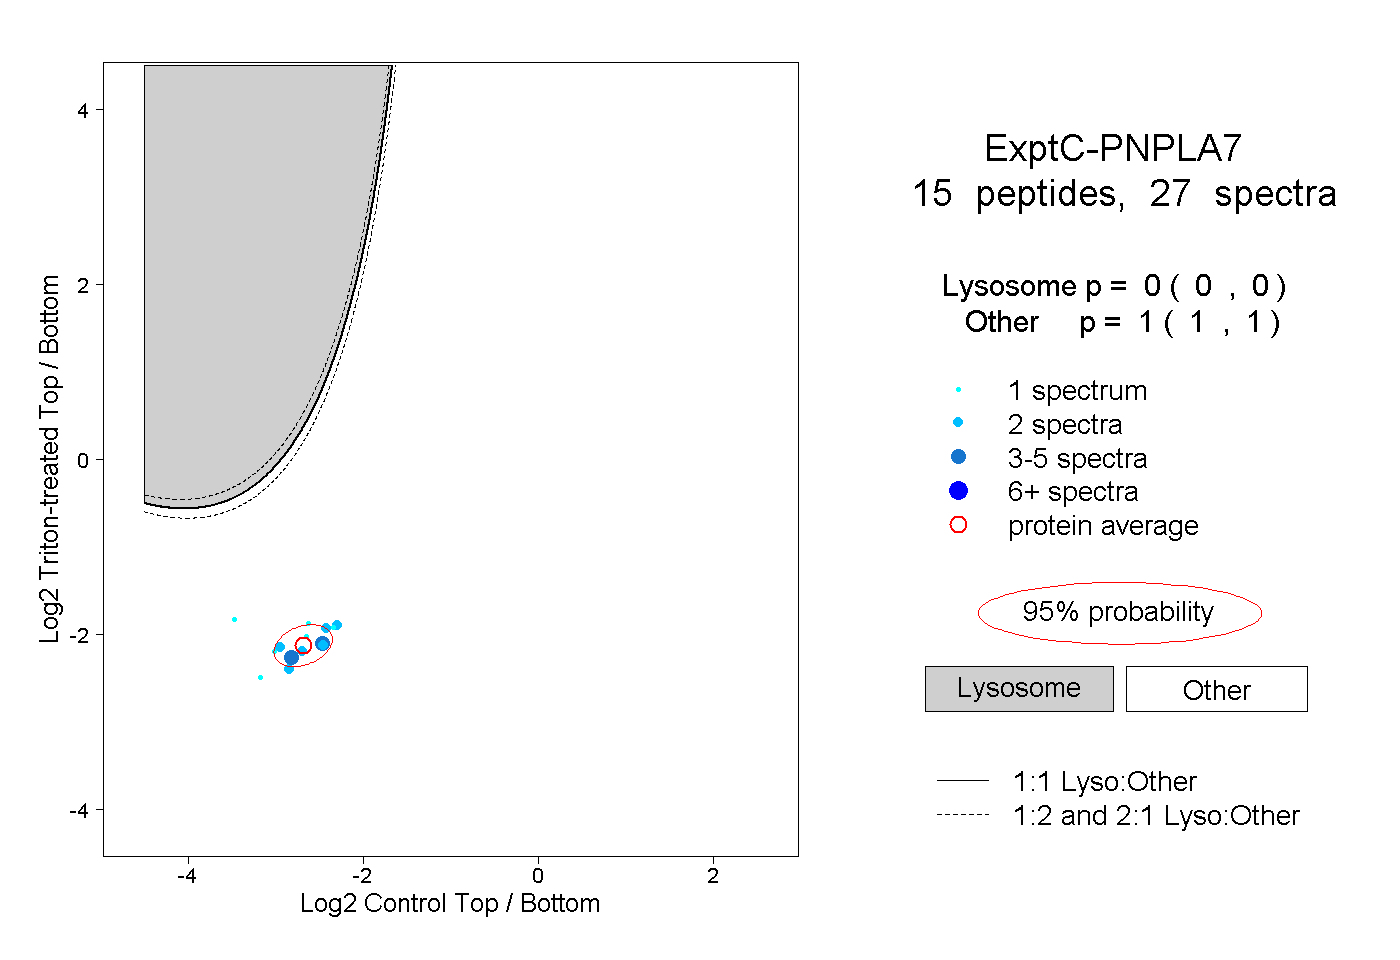
0.000 | 0.000
1.000 | 1.000
1peptide
spectra
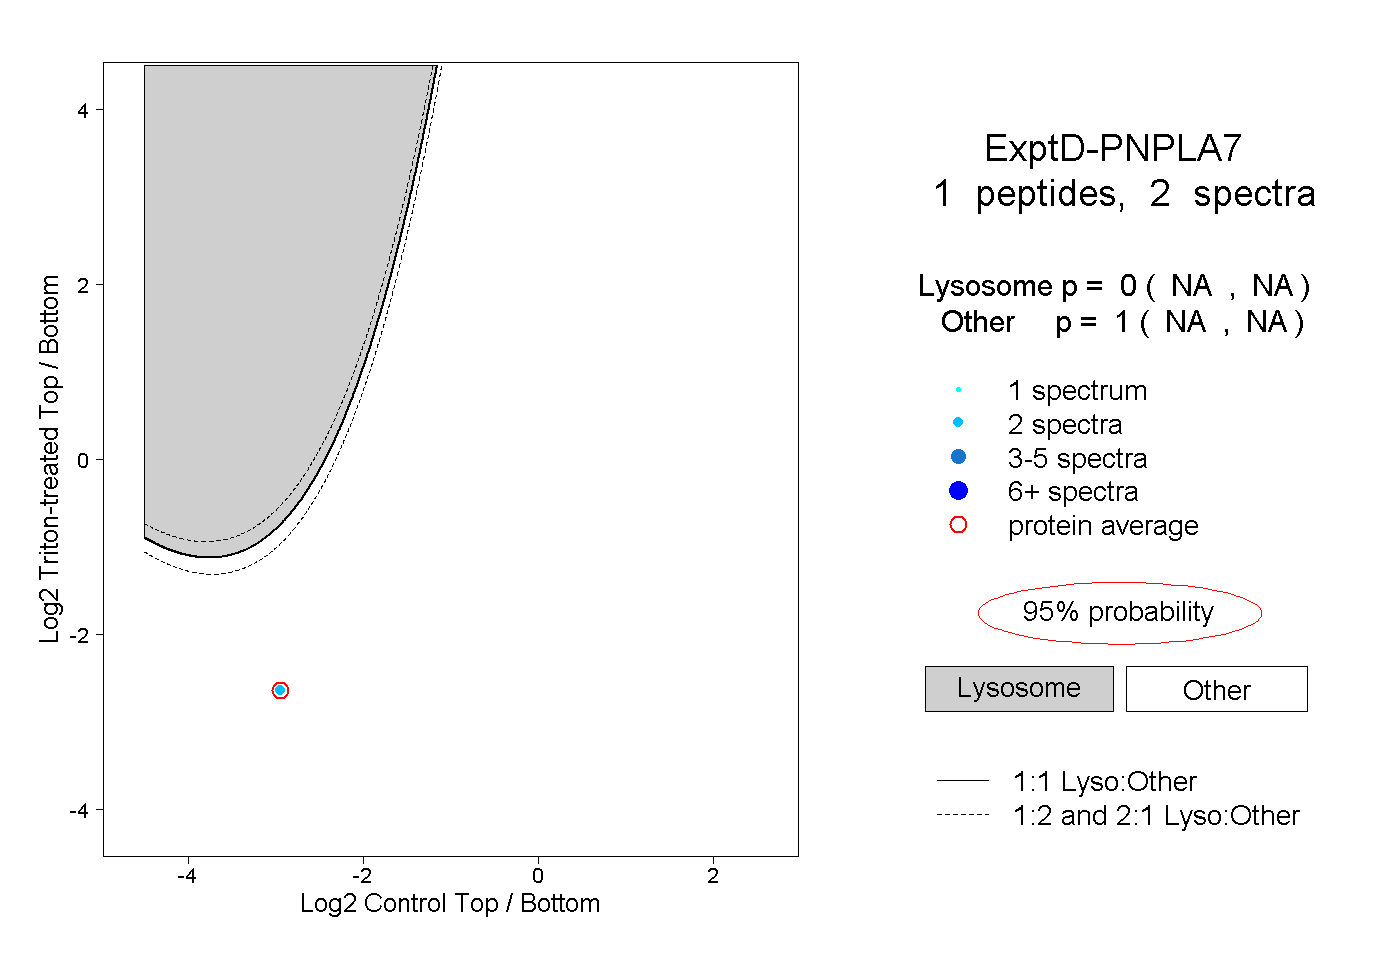
NA | NA
NA | NA