 24
24peptides
spectra
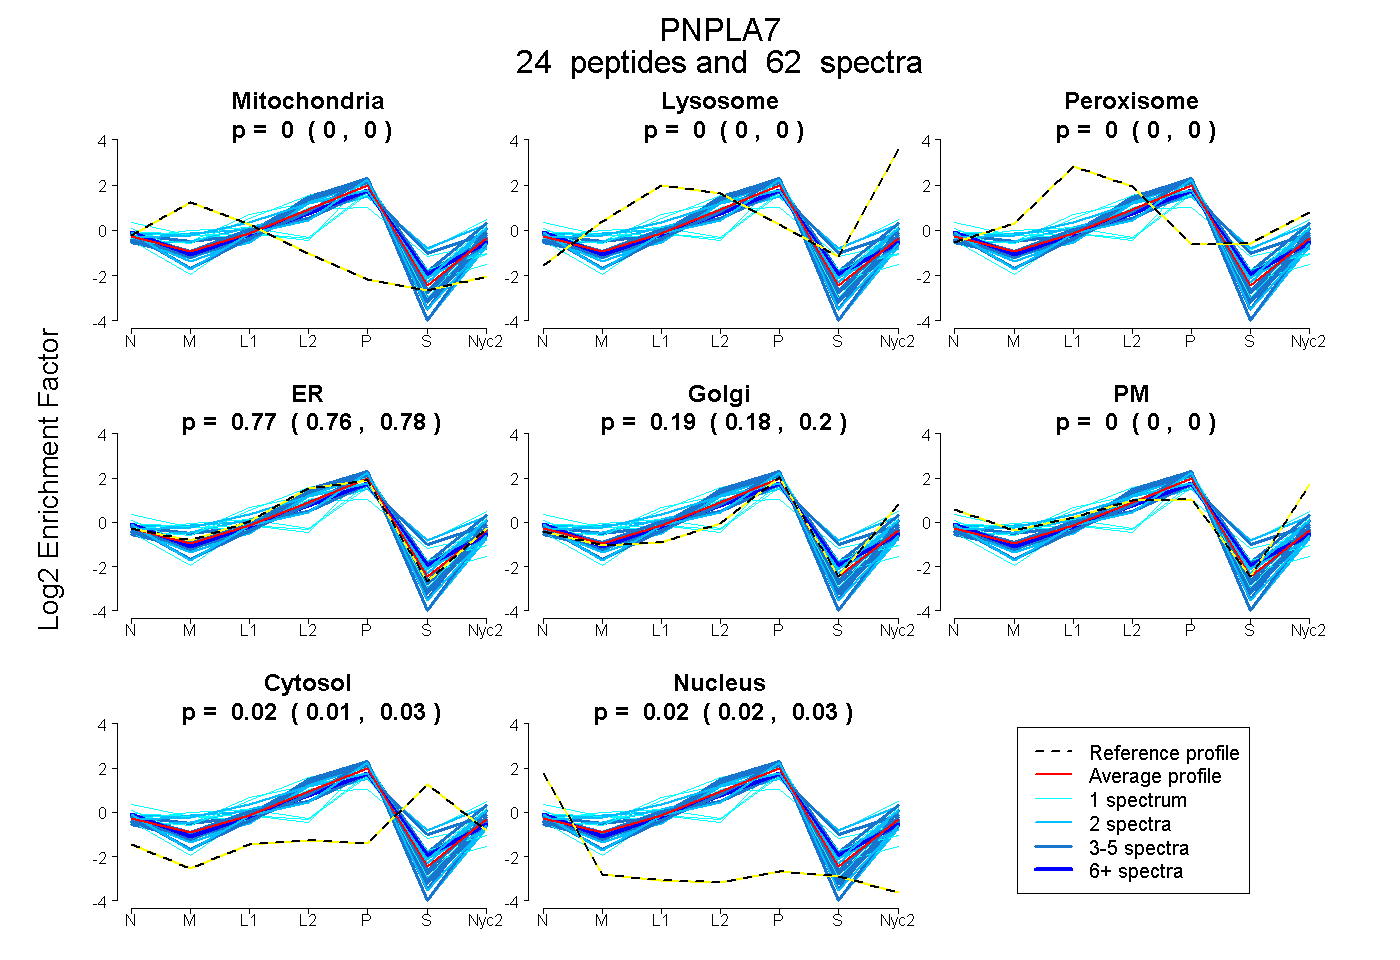
0.000 | 0.000
0.000 | 0.000
0.000 | 0.000
0.756 | 0.776
0.175 | 0.198
0.000 | 0.000
0.012 | 0.029
0.020 | 0.028
| Plot | Mito | Lyso | Perox | ER | Golgi | PM | Cytosol | Nucleus | |||||
| Expt A |
24 peptides |
62 spectra |
|
0.000 0.000 | 0.000 |
0.000 0.000 | 0.000 |
0.000 0.000 | 0.000 |
0.767 0.756 | 0.776 |
0.188 0.175 | 0.198 |
0.000 0.000 | 0.000 |
0.021 0.012 | 0.029 |
0.024 0.020 | 0.028 |
| 1 spectrum, VHTDGSLWR | 0.123 | 0.000 | 0.000 | 0.782 | 0.000 | 0.000 | 0.095 | 0.000 | ||
| 1 spectrum, TDAIFR | 0.000 | 0.036 | 0.007 | 0.957 | 0.000 | 0.000 | 0.000 | 0.000 | ||
| 4 spectra, VVQIIMVR | 0.000 | 0.000 | 0.000 | 0.591 | 0.388 | 0.000 | 0.000 | 0.021 | ||
| 2 spectra, DEPGPSGR | 0.000 | 0.000 | 0.000 | 0.971 | 0.000 | 0.000 | 0.000 | 0.029 | ||
| 4 spectra, LDDPSLLDGR | 0.000 | 0.000 | 0.000 | 0.962 | 0.014 | 0.000 | 0.000 | 0.025 | ||
| 2 spectra, YPETLVR | 0.000 | 0.000 | 0.000 | 0.671 | 0.244 | 0.000 | 0.000 | 0.085 | ||
| 1 spectrum, QMSYGPEEQLER | 0.000 | 0.000 | 0.000 | 0.549 | 0.246 | 0.000 | 0.056 | 0.150 | ||
| 1 spectrum, LSSWLGQQEDIHR | 0.086 | 0.000 | 0.109 | 0.566 | 0.000 | 0.079 | 0.144 | 0.016 | ||
| 4 spectra, MSSFVR | 0.000 | 0.087 | 0.000 | 0.676 | 0.182 | 0.000 | 0.055 | 0.000 | ||
| 2 spectra, QWAEDMTSMVK | 0.091 | 0.000 | 0.064 | 0.499 | 0.302 | 0.045 | 0.000 | 0.000 | ||
| 2 spectra, VAFLHVPAGTIVSK | 0.000 | 0.000 | 0.000 | 0.888 | 0.000 | 0.000 | 0.088 | 0.024 | ||
| 2 spectra, YPQVVTR | 0.008 | 0.009 | 0.159 | 0.612 | 0.211 | 0.000 | 0.000 | 0.000 | ||
| 2 spectra, EEGPAPSR | 0.000 | 0.000 | 0.000 | 0.911 | 0.043 | 0.000 | 0.000 | 0.046 | ||
| 1 spectrum, SCSVPLPPIHGEIDELR | 0.143 | 0.000 | 0.134 | 0.000 | 0.723 | 0.000 | 0.000 | 0.000 | ||
| 3 spectra, TVFDIWVR | 0.000 | 0.000 | 0.000 | 0.959 | 0.040 | 0.000 | 0.000 | 0.001 | ||
| 1 spectrum, ILPHSEEQLGSSLASK | 0.000 | 0.000 | 0.148 | 0.000 | 0.662 | 0.015 | 0.175 | 0.000 | ||
| 3 spectra, VMFYGR | 0.000 | 0.000 | 0.120 | 0.418 | 0.288 | 0.000 | 0.175 | 0.000 | ||
| 6 spectra, VTTLPHTLVGNTAAPR | 0.000 | 0.000 | 0.000 | 0.755 | 0.105 | 0.000 | 0.109 | 0.032 | ||
| 4 spectra, VLNMAEIQTR | 0.000 | 0.000 | 0.000 | 0.825 | 0.170 | 0.000 | 0.000 | 0.005 | ||
| 5 spectra, LIHLLGEK | 0.000 | 0.000 | 0.000 | 0.975 | 0.006 | 0.000 | 0.000 | 0.019 | ||
| 2 spectra, LPAGALTSIK | 0.000 | 0.013 | 0.244 | 0.256 | 0.353 | 0.000 | 0.134 | 0.000 | ||
| 4 spectra, QLILLHK | 0.000 | 0.000 | 0.000 | 0.921 | 0.050 | 0.000 | 0.000 | 0.028 | ||
| 1 spectrum, GCAQVGILR | 0.060 | 0.000 | 0.105 | 0.804 | 0.000 | 0.000 | 0.031 | 0.000 | ||
| 4 spectra, GDLVGVVEMLTHQAR | 0.045 | 0.000 | 0.030 | 0.710 | 0.125 | 0.000 | 0.090 | 0.000 |
| Plot | Mito | Lyso or Perox | ER | Golgi | PM | Cytosol | Nucleus | ||||||
| Expt B |
6 peptides |
8 spectra |
 |
0.000 0.000 | 0.000 |
0.005 0.000 | 0.045 |
0.904 0.800 | 0.930 |
0.064 0.031 | 0.117 |
0.000 0.000 | 0.000 |
0.027 0.000 | 0.054 |
0.000 0.000 | 0.000 |
|||
| Plot | Lyso | Other | |||||||||||
| Expt C |
15 peptides |
27 spectra |
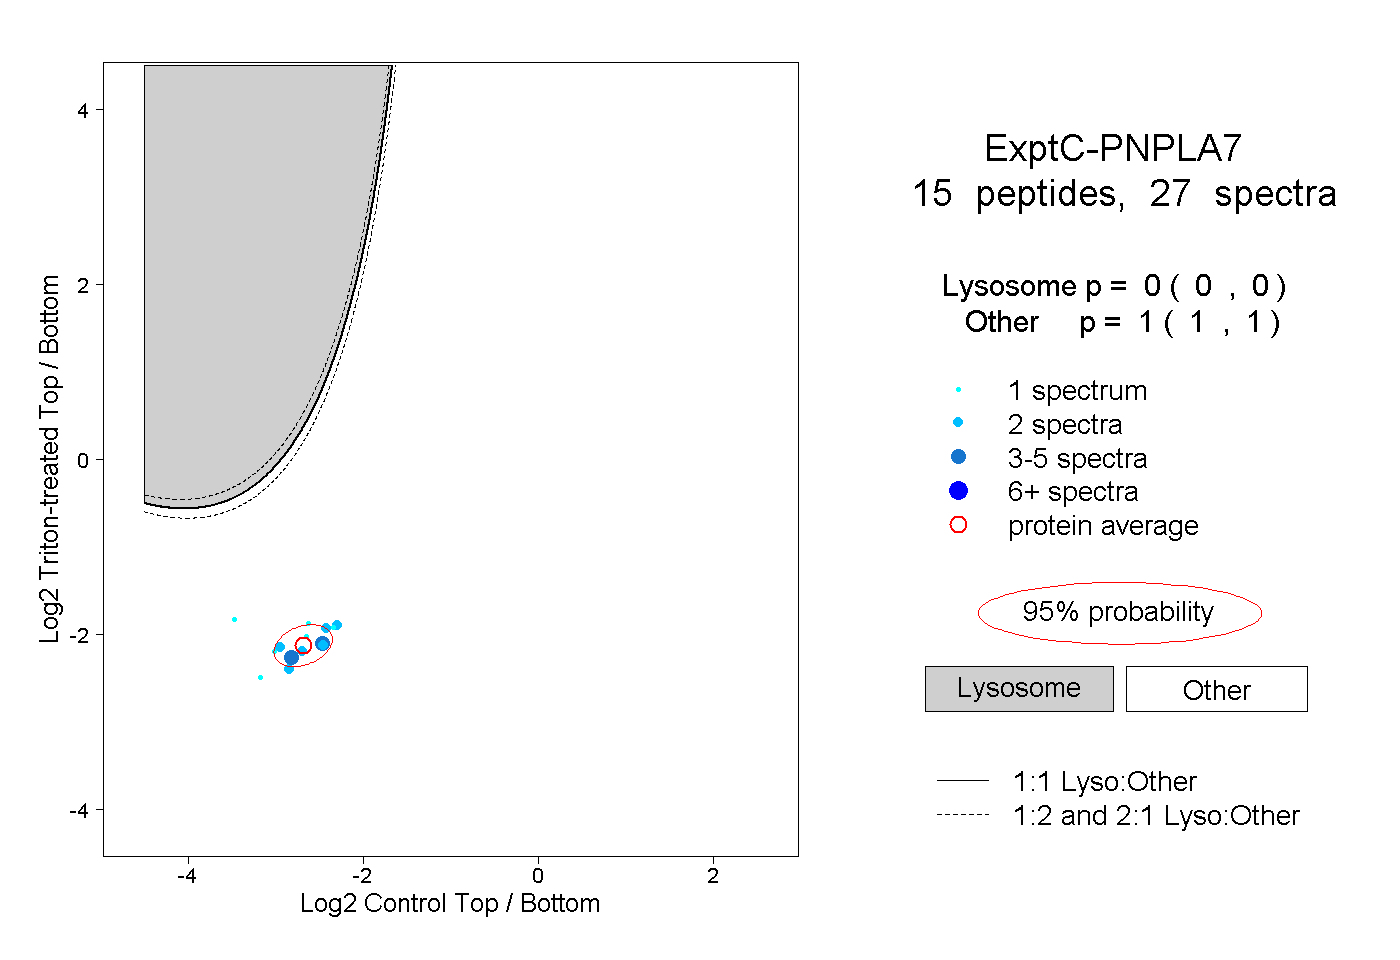 |
0.000 0.000 | 0.000 |
1.000 1.000 | 1.000 |
||||||||
| Plot | Lyso | Other | |||||||||||
| Expt D |
1 peptide |
2 spectra |
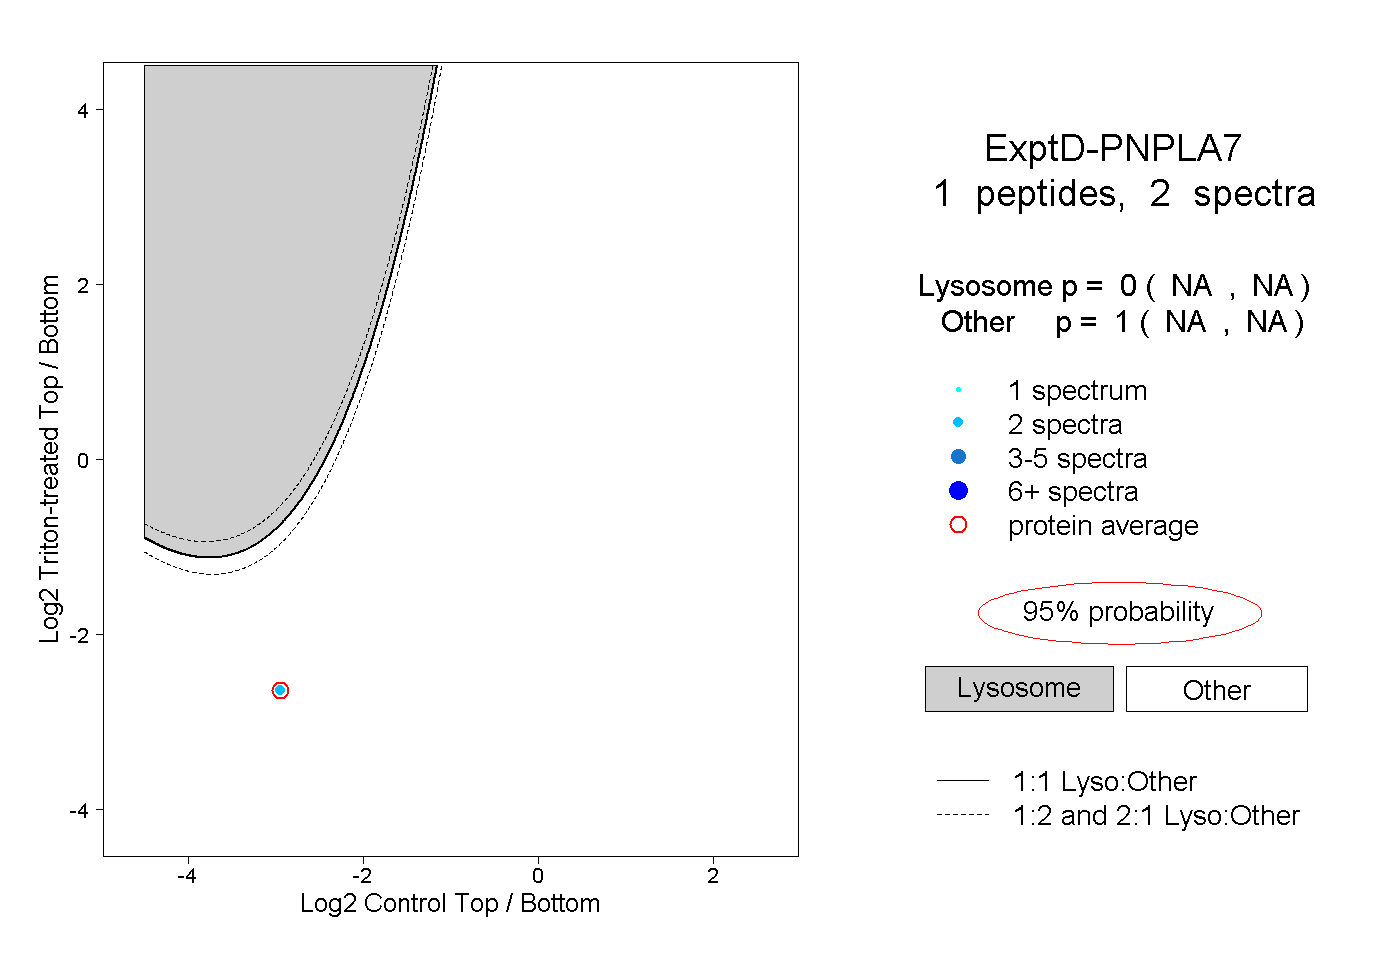 |
0.000 NA | NA |
1.000 NA | NA |