 8
8peptides
spectra
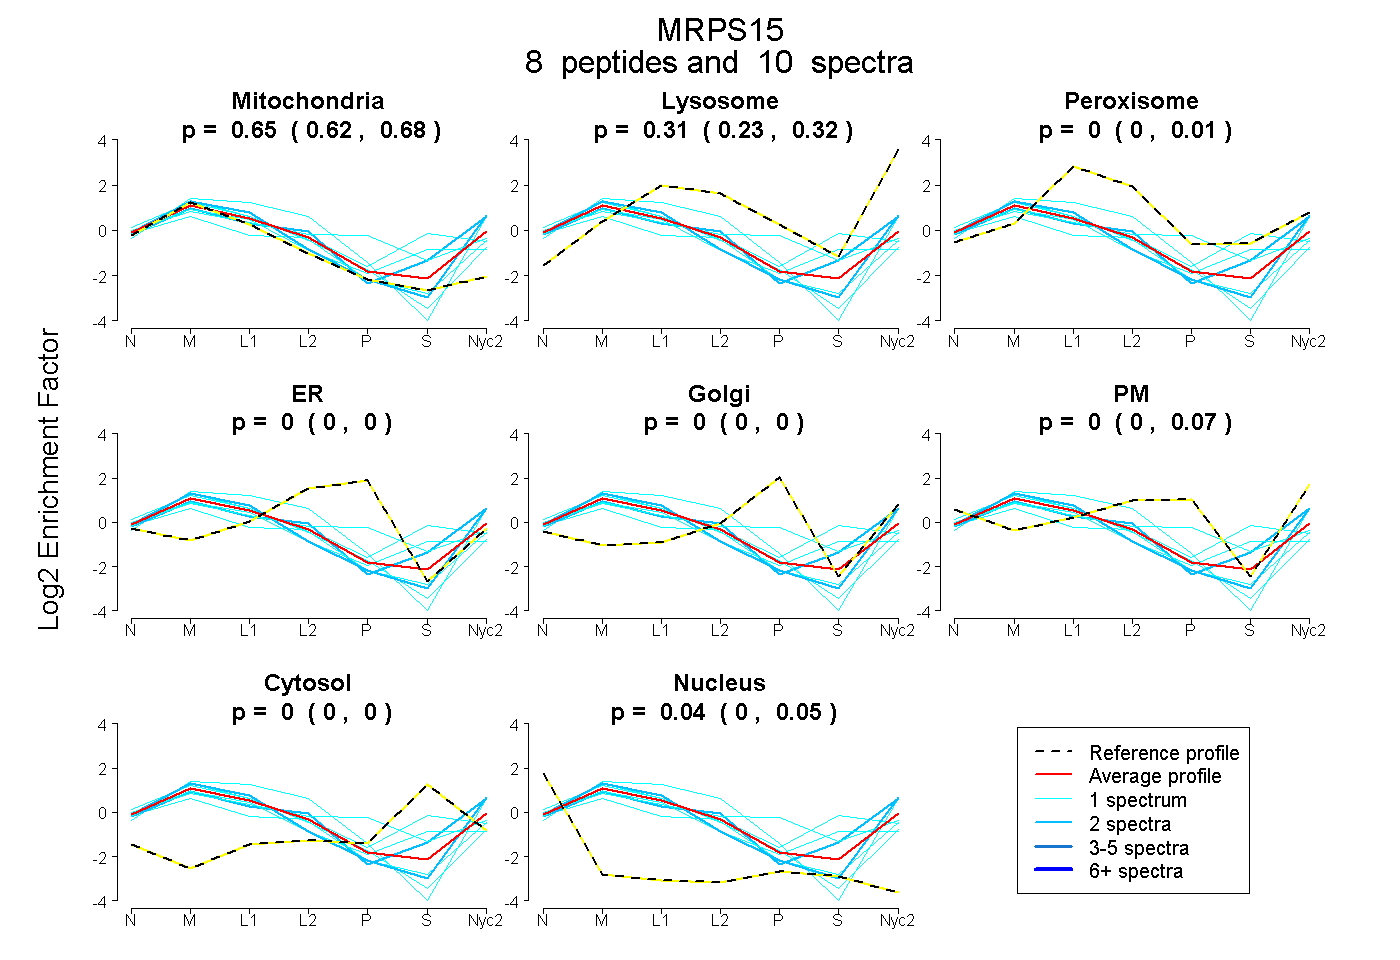
0.625 | 0.684
0.232 | 0.320
0.000 | 0.011
0.000 | 0.000
0.000 | 0.000
0.000 | 0.072
0.000 | 0.000
0.005 | 0.049
1peptide
spectra
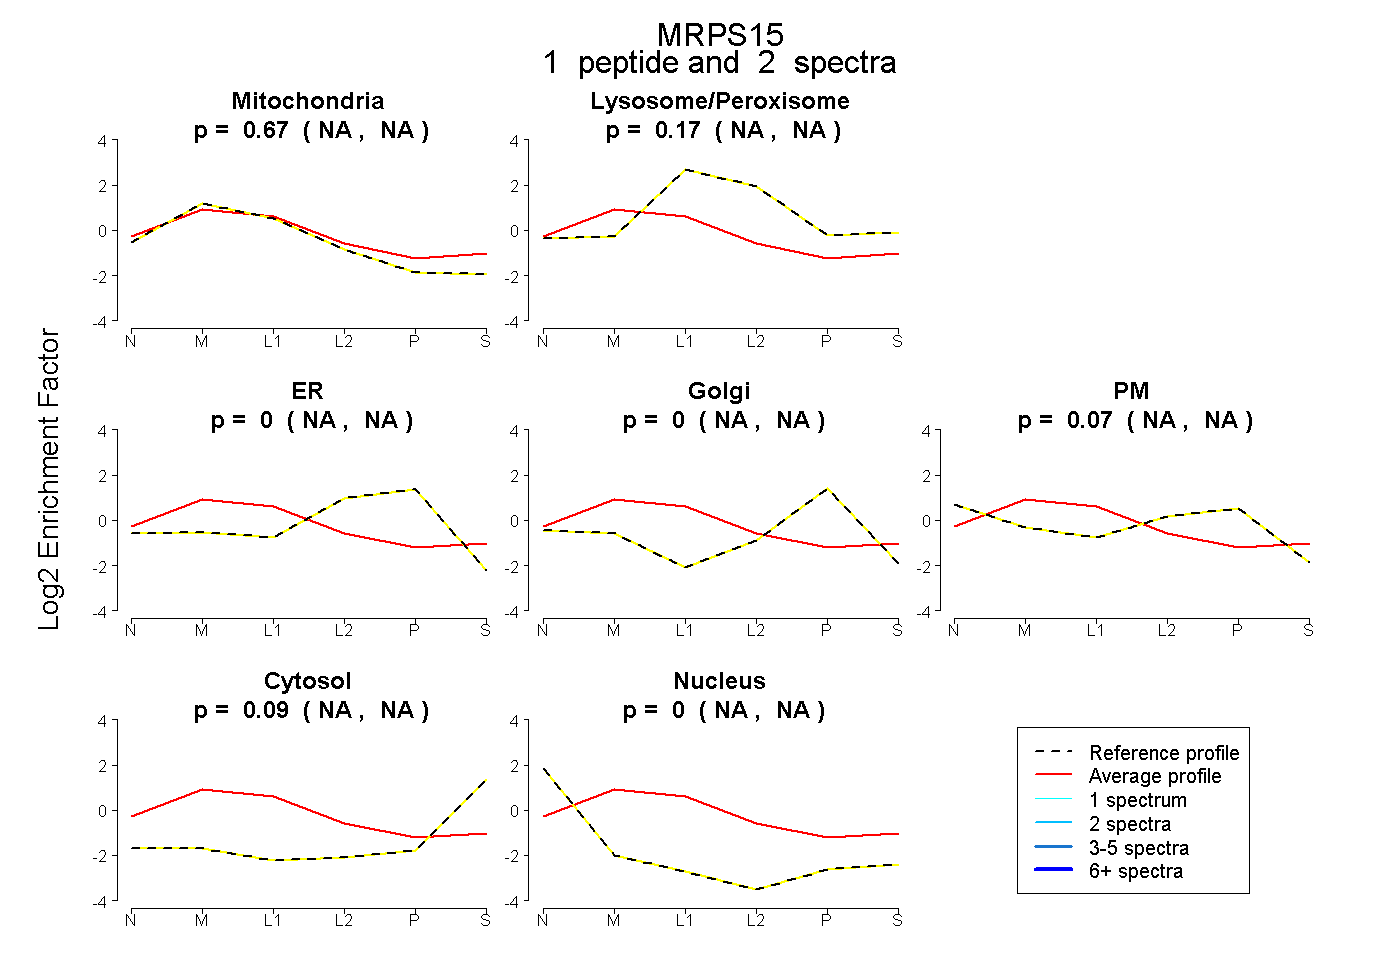
NA | NA
NA | NA
NA | NA
NA | NA
NA | NA
NA | NA
NA | NA
12peptides
spectra
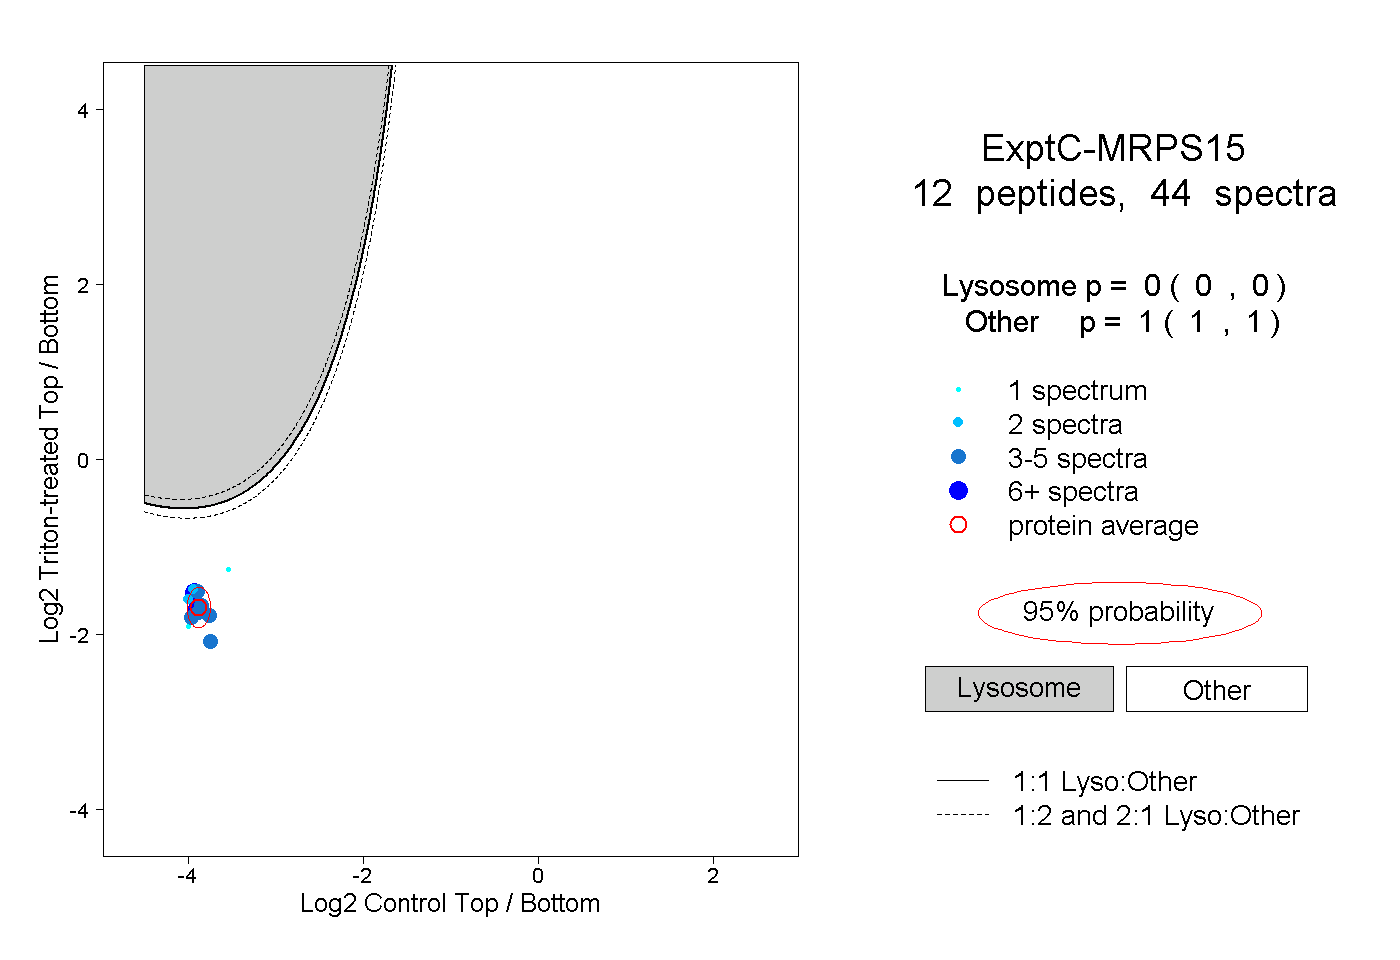
0.000 | 0.000
1.000 | 1.000
2peptides
spectra
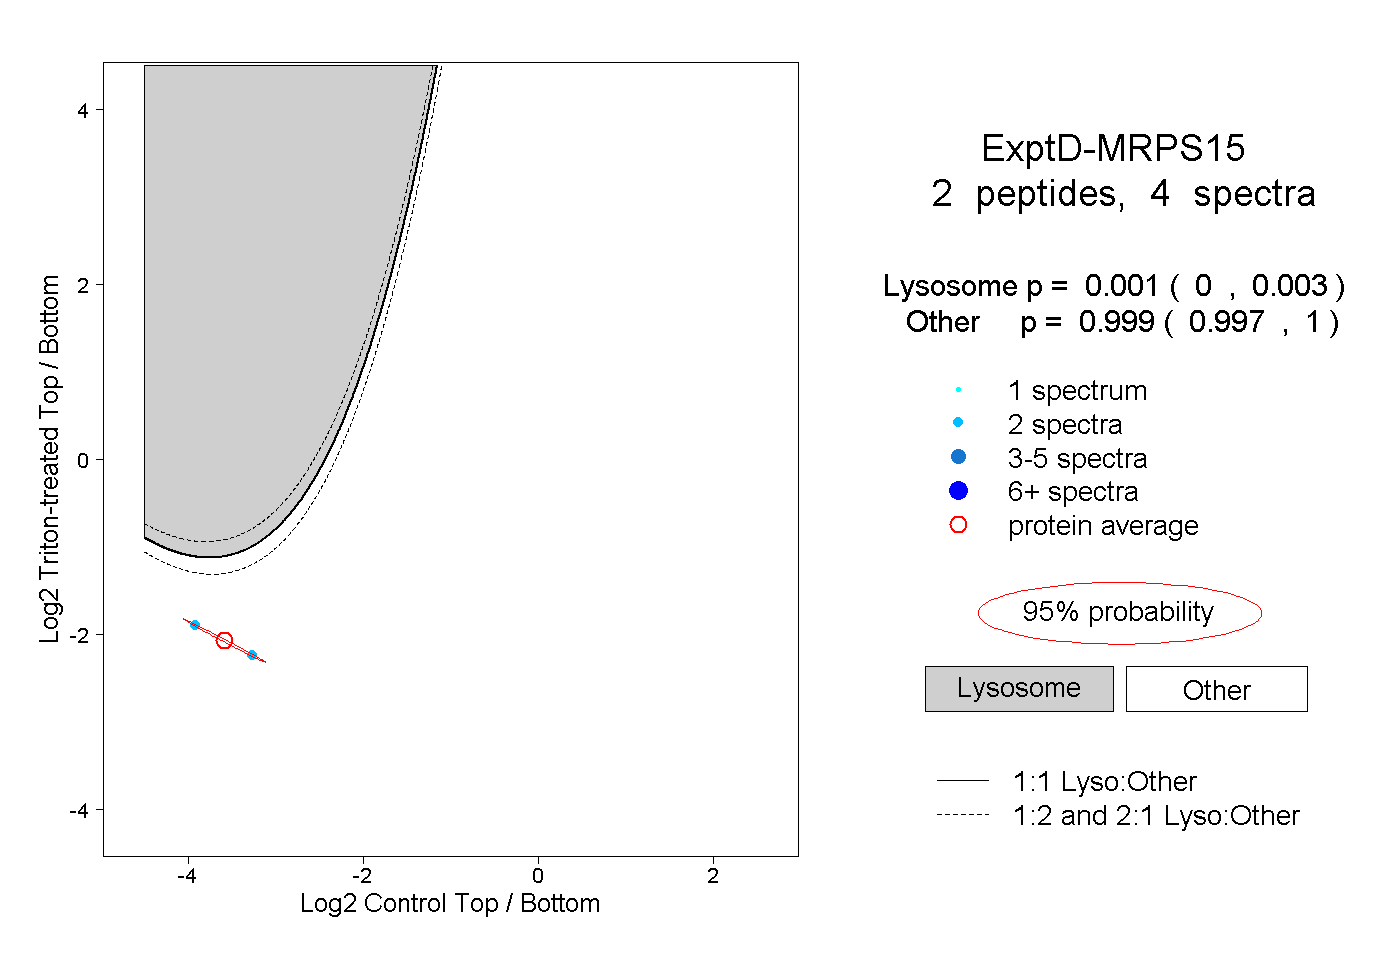
0.000 | 0.003
0.997 | 1.000