 8
8peptides
spectra
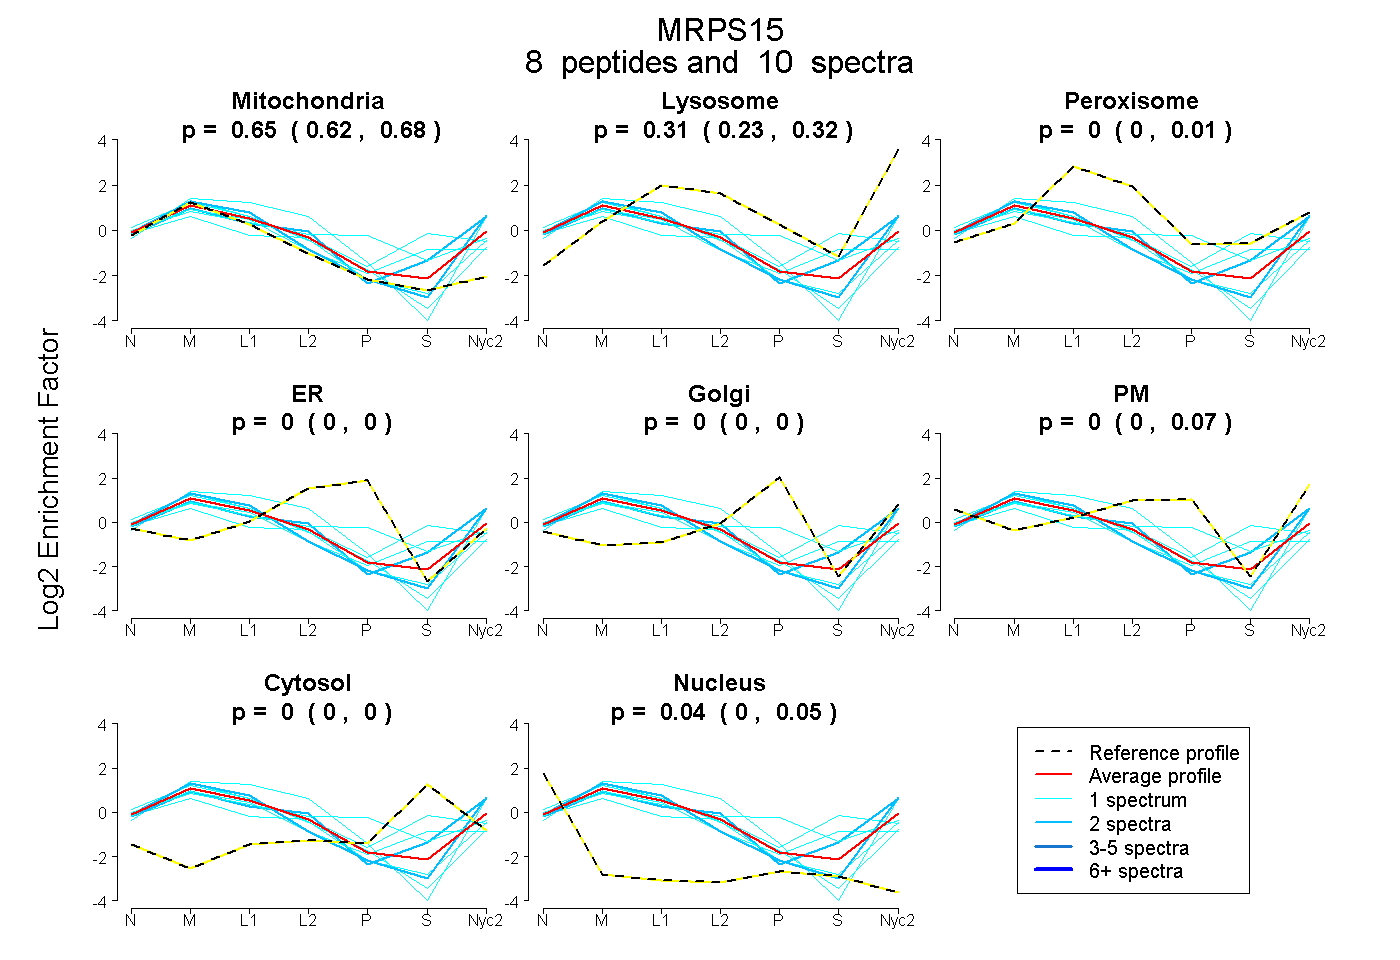
0.625 | 0.684
0.232 | 0.320
0.000 | 0.011
0.000 | 0.000
0.000 | 0.000
0.000 | 0.072
0.000 | 0.000
0.005 | 0.049
| Plot | Mito | Lyso | Perox | ER | Golgi | PM | Cytosol | Nucleus | |||||
| Expt A |
8 peptides |
10 spectra |
|
0.654 0.625 | 0.684 |
0.306 0.232 | 0.320 |
0.000 0.000 | 0.011 |
0.000 0.000 | 0.000 |
0.000 0.000 | 0.000 |
0.000 0.000 | 0.072 |
0.000 0.000 | 0.000 |
0.040 0.005 | 0.049 |
| 1 spectrum, QDDEPASSTFIK | 0.766 | 0.028 | 0.000 | 0.000 | 0.000 | 0.206 | 0.000 | 0.000 | ||
| 1 spectrum, NIIPNMEK | 0.795 | 0.205 | 0.000 | 0.000 | 0.000 | 0.000 | 0.000 | 0.000 | ||
| 1 spectrum, ALCIQVFQEVQK | 0.555 | 0.307 | 0.000 | 0.000 | 0.000 | 0.137 | 0.000 | 0.000 | ||
| 2 spectra, HLLMSIDQR | 0.542 | 0.352 | 0.000 | 0.000 | 0.000 | 0.000 | 0.088 | 0.018 | ||
| 1 spectrum, IAENPEDYR | 0.606 | 0.011 | 0.195 | 0.000 | 0.000 | 0.000 | 0.187 | 0.000 | ||
| 2 spectra, QTNYDVFEK | 0.694 | 0.301 | 0.000 | 0.000 | 0.000 | 0.000 | 0.000 | 0.004 | ||
| 1 spectrum, ELGVEYALPPLHFQR | 0.419 | 0.072 | 0.180 | 0.000 | 0.000 | 0.000 | 0.329 | 0.000 | ||
| 1 spectrum, VDDVVK | 0.412 | 0.000 | 0.224 | 0.000 | 0.205 | 0.104 | 0.054 | 0.000 |
| Plot | Mito | Lyso or Perox | ER | Golgi | PM | Cytosol | Nucleus | ||||||
| Expt B |
1 peptide |
2 spectra |
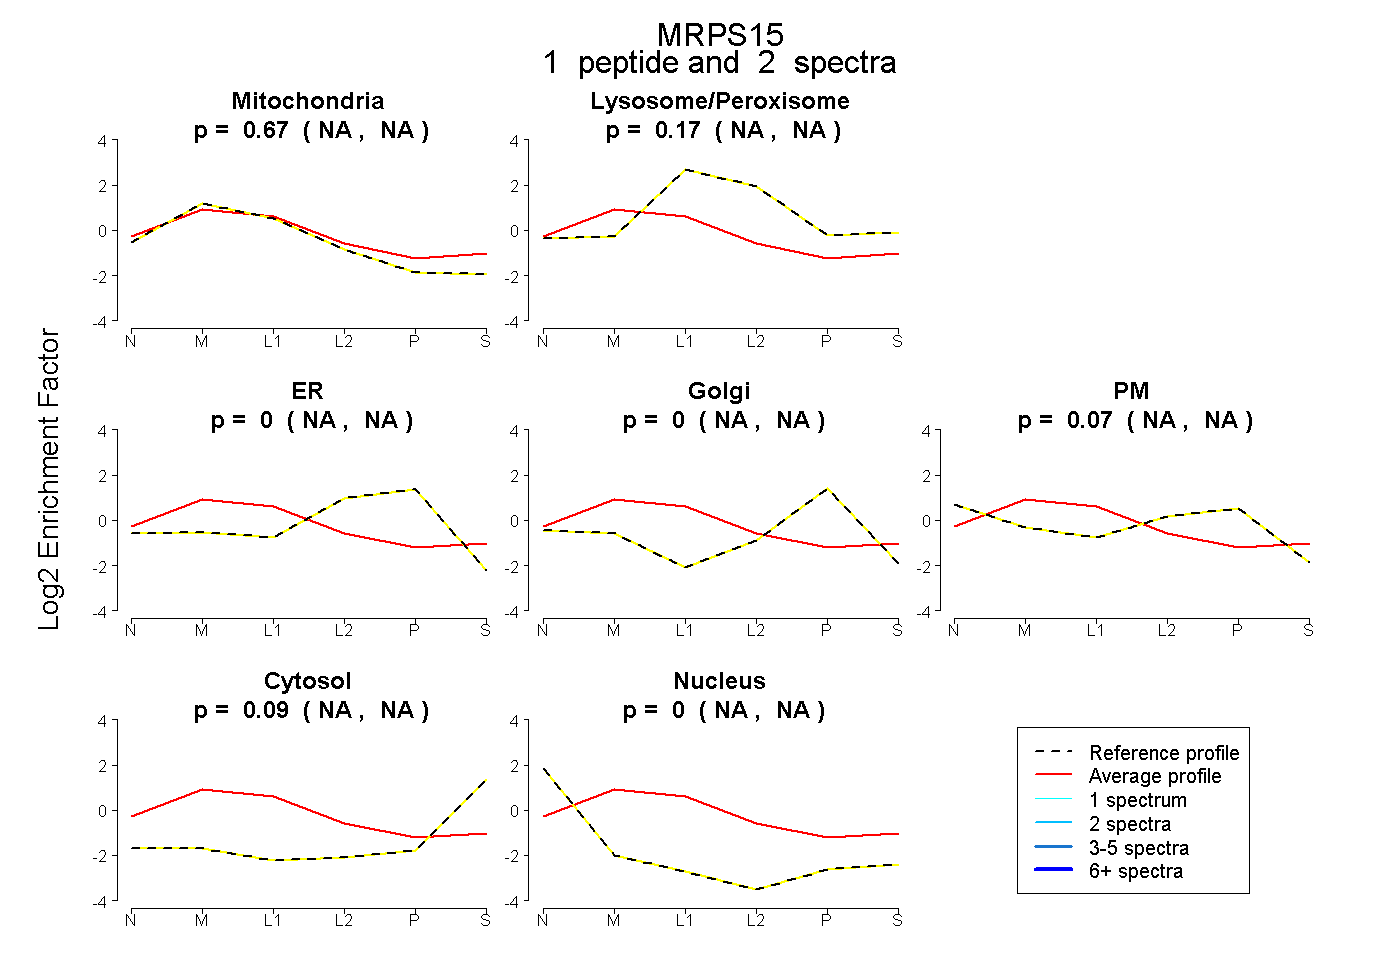 |
0.673 NA | NA |
0.171 NA | NA |
0.000 NA | NA |
0.000 NA | NA |
0.071 NA | NA |
0.085 NA | NA |
0.000 NA | NA |
|||
| Plot | Lyso | Other | |||||||||||
| Expt C |
12 peptides |
44 spectra |
 |
0.000 0.000 | 0.000 |
1.000 1.000 | 1.000 |
||||||||
| Plot | Lyso | Other | |||||||||||
| Expt D |
2 peptides |
4 spectra |
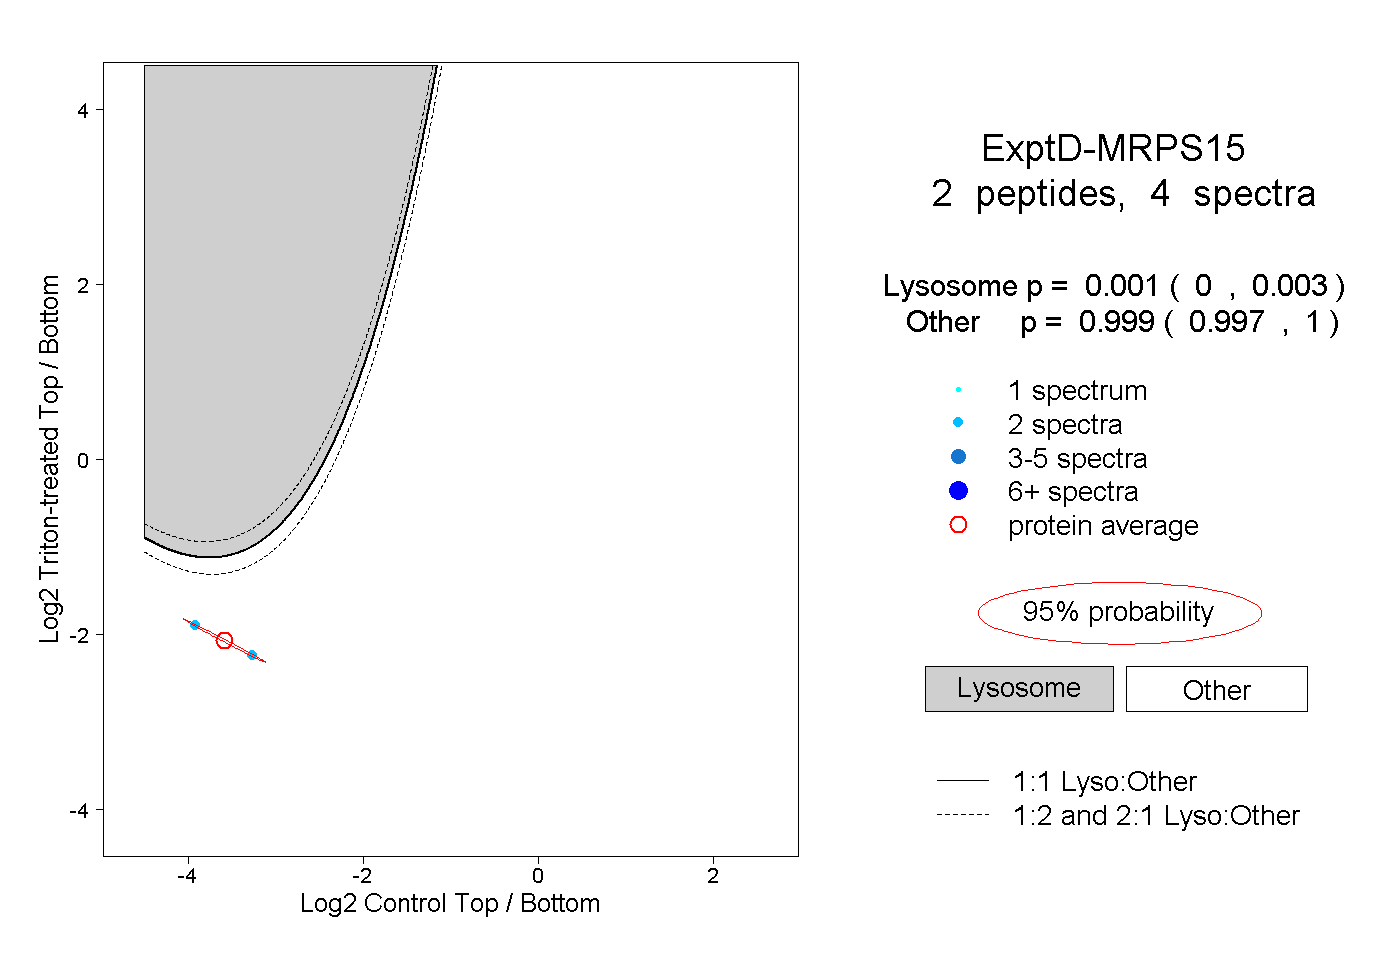 |
0.001 0.000 | 0.003 |
0.999 0.997 | 1.000 |