 4
4peptides
spectra
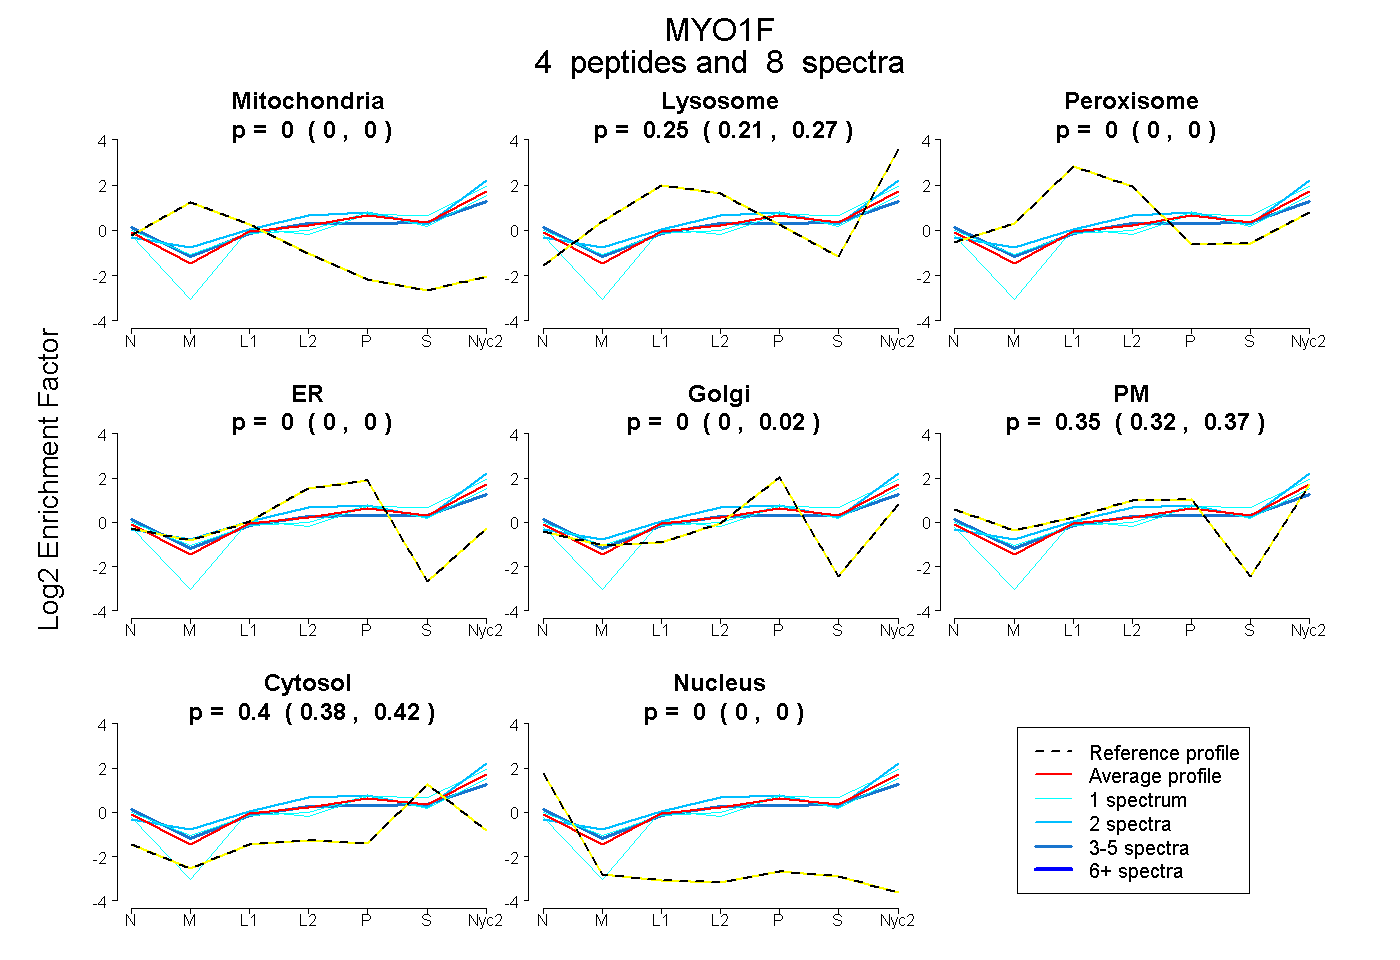
0.000 | 0.000
0.214 | 0.272
0.000 | 0.000
0.000 | 0.000
0.000 | 0.016
0.323 | 0.373
0.379 | 0.418
0.000 | 0.000
3peptides
spectra
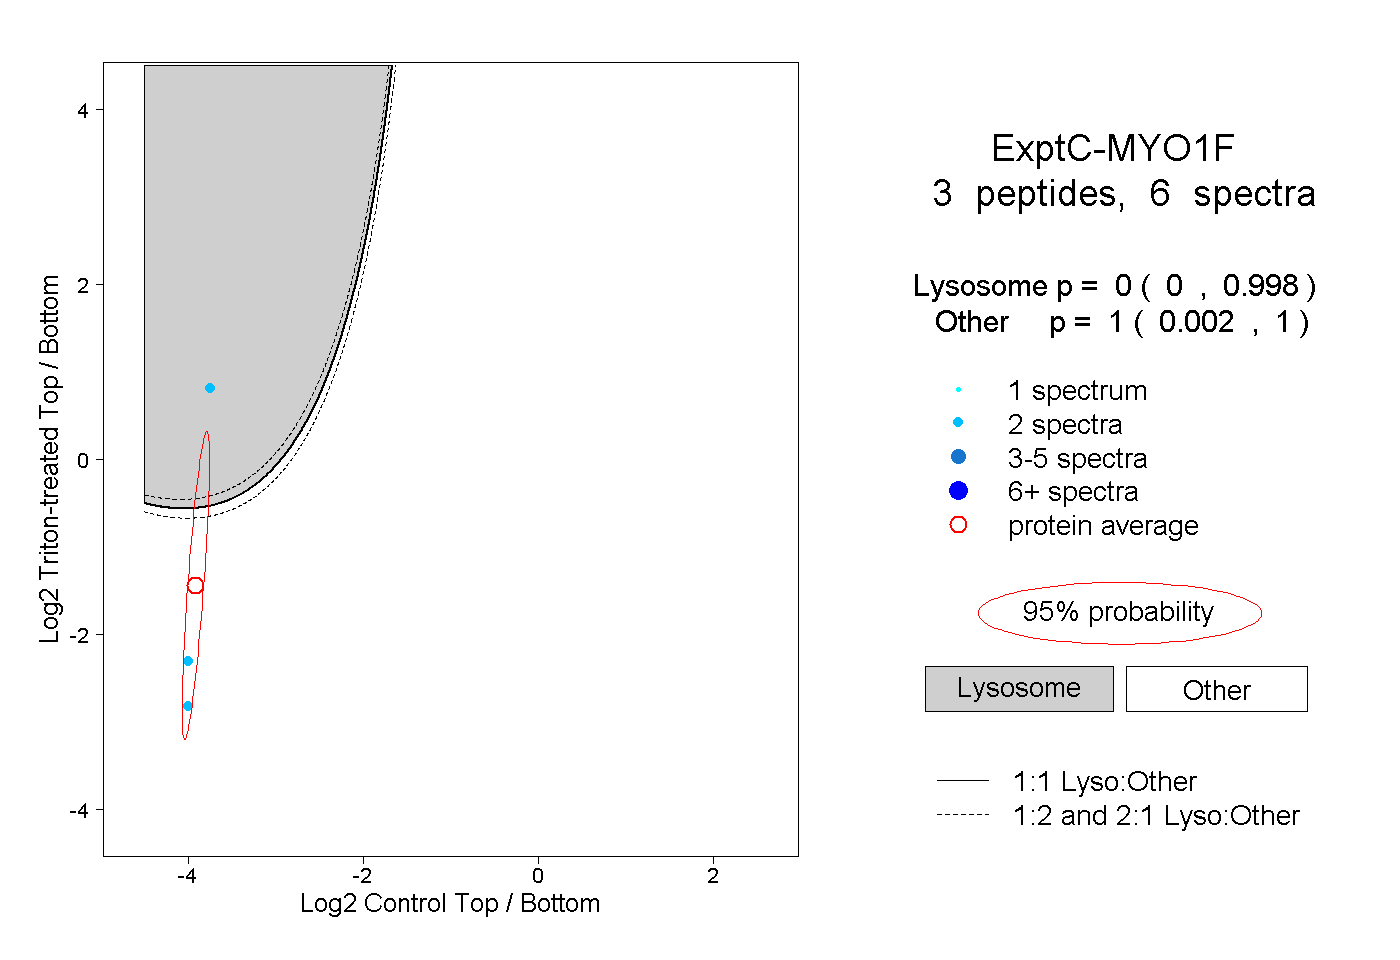
0.000 | 0.998
0.002 | 1.000
1peptide
spectra
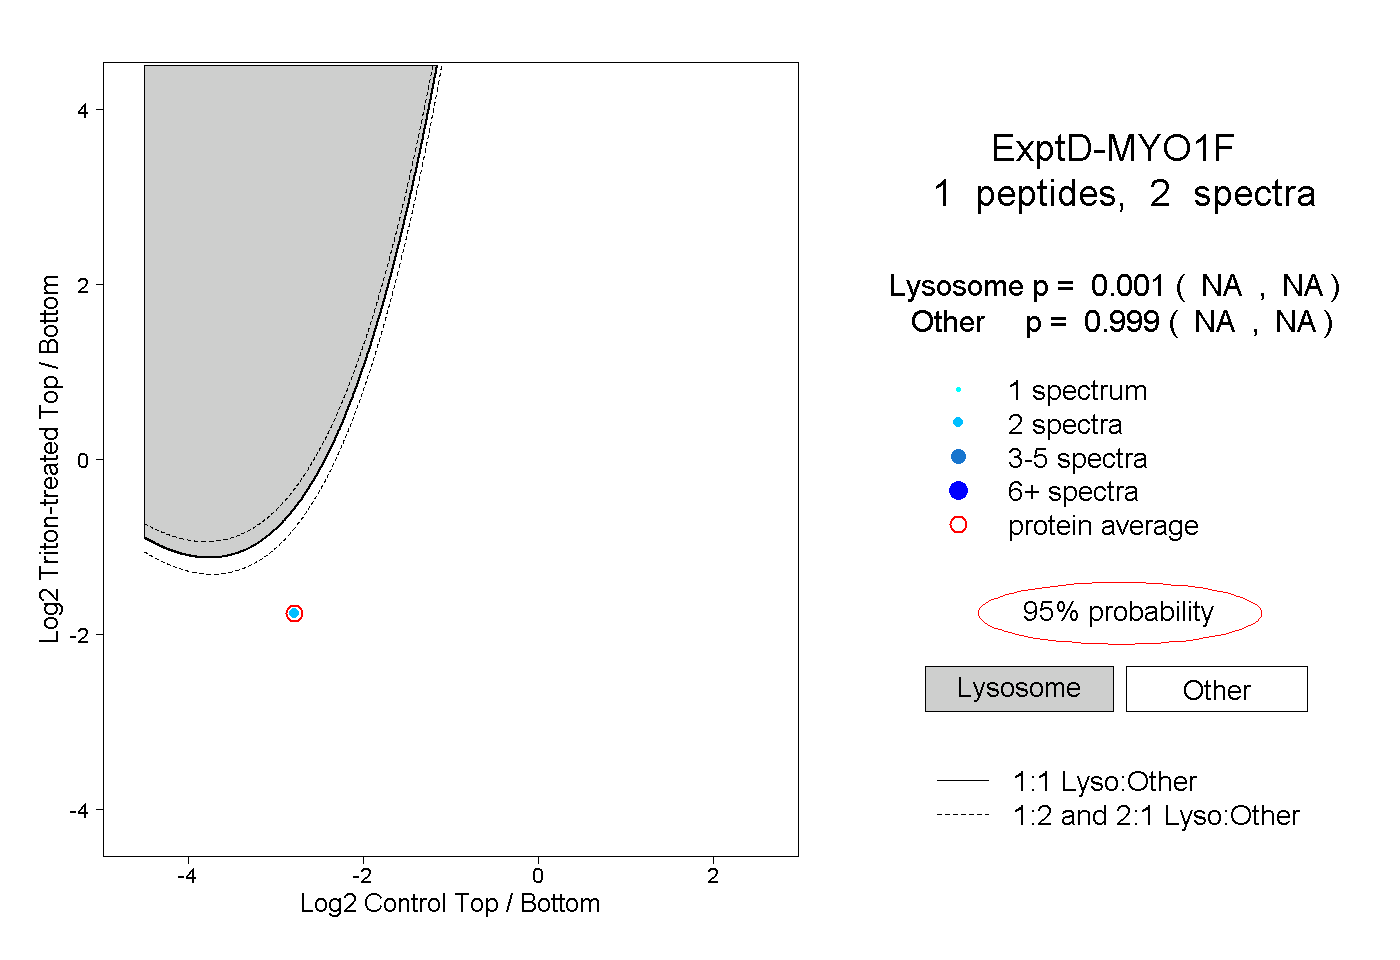
NA | NA
NA | NA